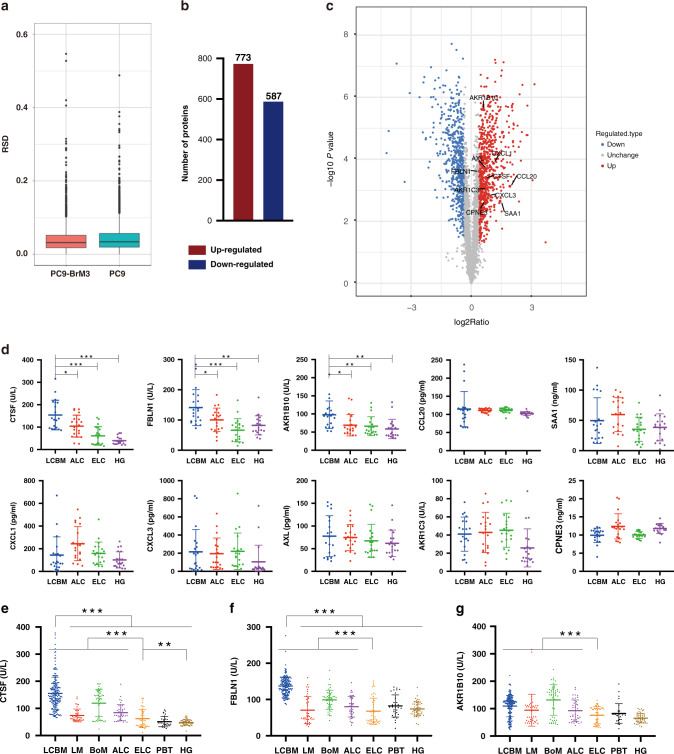
Fig. 2. Proteomics was used to screen candidate proteins.
a The RSD distribution of QC samples. b Protein expression profile of PC9-BrM3 compared to parent PC9. c Volcano plot shows the upregulation of candidate proteins. d Results of enzyme-linked immunosorbent assay (ELISA) showing serum levels of ten candidate proteins in each clinical group in cohort 1. Results of ELISA showing serum levels of Cathepsin F (CTSF) (e), Fibulin-1 (FBLN1) (f) and Aldo-keto reductase family 1 member B10 (AKR1B10) (g) in each clinical group in cohort 2. Each dot corresponds to a single individual. Data are presented as mean ± SD; ***P < 0.001; **P < 0.01; *P < 0.05. LCBM non-small cell lung cancer (NSCLC) brain metastasis (BM), LM single organ liver metastasis, BoM single organ bone metastasis, ALC advanced NSCLC without distant organ metastasis, ELC early-stage NSCLC, PBT primary brain tumours, HG healthy group. The graphs show summarised results from three independent experiments.

