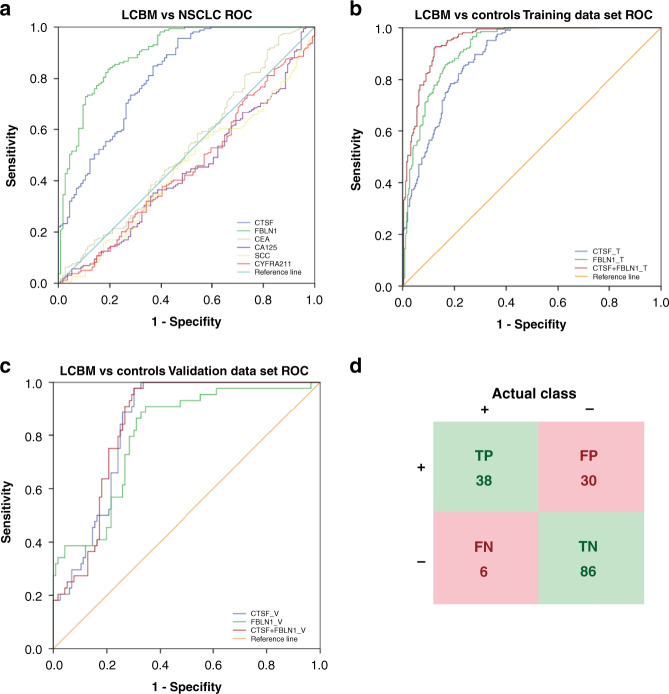
Fig. 4. Receiver operating characteristic (ROC) curve analysis of Cathepsin F (CTSF) and Fibulin-1 (FBLN1).
a ROC curve analysis of CTSF, FBLN1, carcinoembryonic antigen (CEA), carbohydrate antigen 125 (CA125), squamous cell carcinoma antigen (SCC) and cytokeratin fragment 21–1 (CYFRA21-1) for differentiating non-small cell lung cancer brain metastasis (LCBM) and non-small cell lung cancer (NSCLC) patients [single organ liver metastasis (LM), single organ bone metastasis (BoM), advanced NSCLC without distant organ metastasis (ALC) and early-stage NSCLC (ELC)] in cohort 2. ROC curve analysis of CTSF, FBLN1 and combination in patients with LCBM versus controls [LM, BoM, ALC, ELC, primary brain tumours (PBT) and healthy group (HG)] in the training dataset (b) and validation dataset (c). d The verification results of the validation dataset using the prediction model and cut-off value. TP true positive, FP false positive, FN false negative, TN true negative. Sensitivity = TP/(TP + FN) *100% = 86.36%; Specificity = TN/ (TN + FP) *100% = 74.14%.

