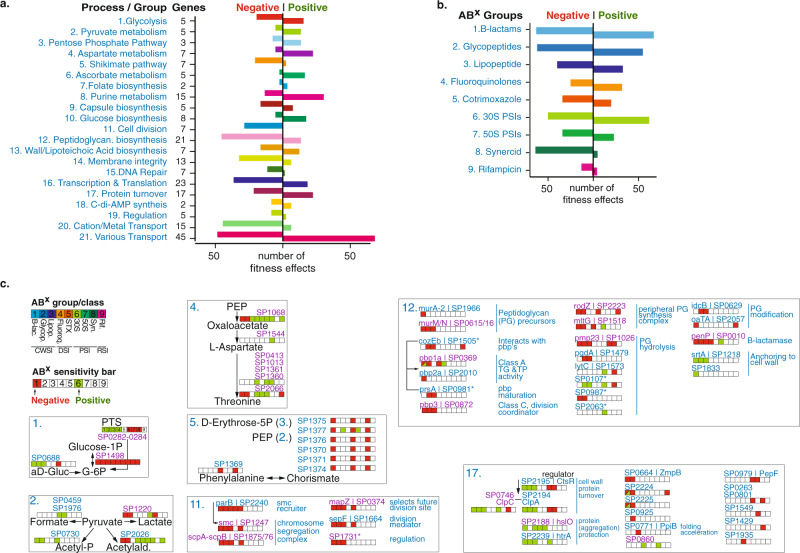
Fig. 3. A multitude of options, pathways, and processes can simultaneously lead to increased and decreased antibiotic susceptibility.
a The number of phenotypes scored for each pathway/process. Genes with at least one significant phenotype are split over 21 groups according to a pathway or process they belong to, which highlights how modulation of most pathways can lead to increased (negative phenotype) and decreased (positive phenotype) antibiotic sensitivity. b The number of phenotypes scored for each antibiotic group. While sensitivity to each antibiotic (group) can be increased by knocking out genes in the genome (negative phenotype), sensitivity can be decreased (positive phenotype) almost as often for most ABXs, except for Synercid, and to a lesser extent rifampicin, where most effects are negative. c Detailed view of 7 out of 21 groups/processes highlighting how modulation of specific targets within each process leads to changes in antibiotic sensitivity. Each group is indicated with a number that is the same as in a. Where possible, genes are ordered according to their place in a process/pathway, and gene numbers (SP_) are combined with gene names and annotation. Each indicated gene is combined with an ‘antibiotic sensitivity bar’ indicating whether disruption leads to increased (red/negative fitness) or decreased (green/positive fitness) sensitivity to a specific or group of antibiotics. When phenotypic responses are the same, multiple genes are indicated with a single bar (e.g. SP0282/SP0283/SP0284 in glycolysis, or SP0413/SP1013/SP1361/SP1360 in Aspartate metabolism). Gene numbers in blue have no effect on growth in the absence of antibiotics when knocked out, while gene numbers in purple have a significant growth defect in the absence of ABXs (see for detailed fitness in the absence and presence of antibiotics Supplementary Data 2). Essential genes are not indicated and genes with an asterisk have a partial or tentative annotation that has not been resolved. All 21 groups are listed in Supplementary Figs 2 and 3. Source data are provided as a Source Data file.

