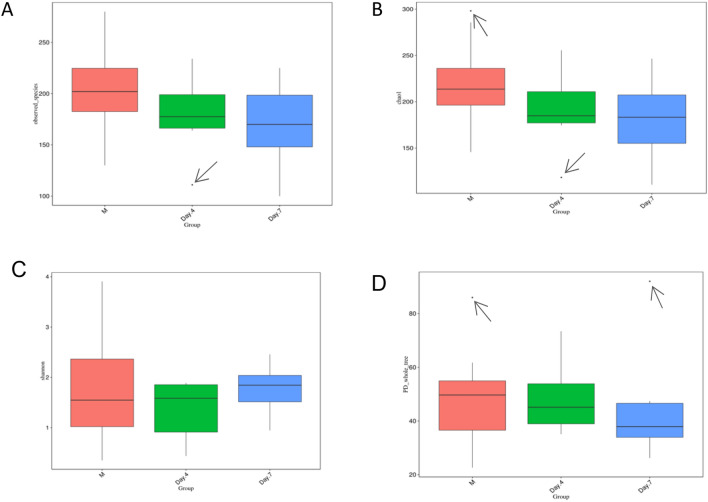
Figure 2.
Differences in alpha diversity indices among groups shown by a boxplot. (A) Observed species, (B) Shannon index, (C) Chao1 index, and (D) Faith’s phylogenetic diversity across three time points. Boxes represent the interquartile ranges (IQRs) among M, Day 4, and Day 7, while the horizontal lines inside the boxes define the medians. Whiskers represent the lowest and highest values within 1.5 times the IQR. Small circle symbols in (A), (C), and (D) indicate outliers (values greater than 1.5 times and less than three times the IQR). Generated by using R Software24.

