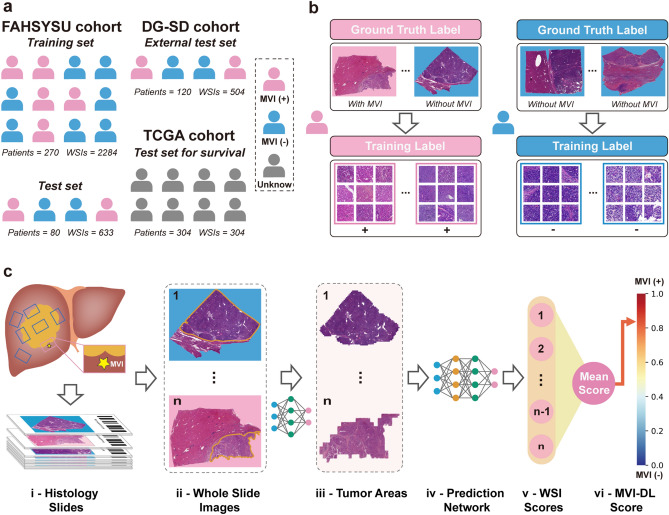
Fig. 1.
Data collection and study design. a Patients from three medical centers and the TCGA dataset were enrolled in this study. b Labelling of the images. All patches on one WSI were considered as a patch bag and shared a same label. If the patient is MVI (−), all its WSIs, namely, patch bags would be labelled as negative; If the patient is MVI ( +), all the patch bags would be labelled as positive, regardless of the existence of MVI. c The flowchart of the MVI-DL model. All WSIs obtained from multipoint sampling were automatically segmented first, and the tumor areas tiled at different magnification scales were then fed into the prediction network. The average of all WSI-level scores formed the MVI-DL score of the patient, and when it is above a certain threshold, the patient is predicted to be MVI ( +)

