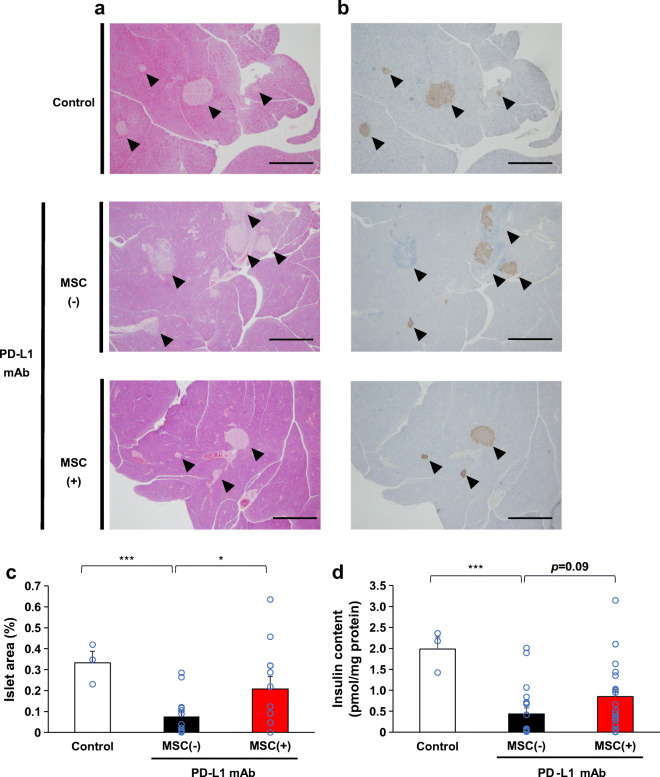
Fig. 2.
Morphological changes and residual pancreatic beta cells. (a) Representative H&E staining and (b) anti-insulin immunostaining of the pancreas 16 days after initiating anti-PD-L1 monoclonal antibody (mAb) treatments: pancreas from a mouse that did not receive anti-PD-L1 mAb or hMSCs (control: normoglycaemic, insulin content was 2.17 pmol/mg), pancreas from an MSC(–) mouse (normoglycaemic, insulin content was 0.41 pmol/mg) and pancreas from an MSC(+) mouse (normoglycaemic, insulin content was 0.95 pmol/mg). The arrowheads indicate islets. Scale bars, 400 μm. (c) The islet area (%) in a whole pancreatic section between groups [control, n=3; MSC(−), n=14; MSC(+), n=12]. (d) Comparison of insulin content in the pancreas between groups [control, n=3; MSC(−), n=20; MSC(+), n=21]. Data are shown as the mean ± SEM. *p˂0.05; ***p˂0.001 between the indicated two groups by Student’s t test

