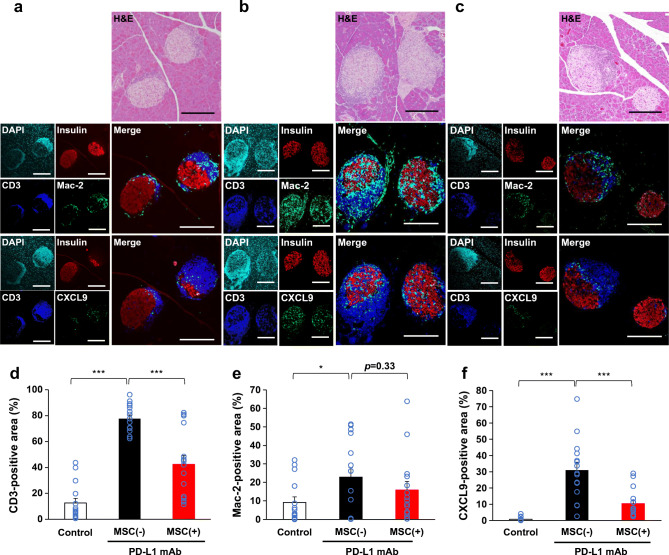
Fig. 3.
Changes of immune cell profiles of the islets. Representative immunostaining images of the pancreases of mice in the three groups (a–c). (a) Pancreas from a mouse not receiving anti-PD-L1 monoclonal antibody (mAb) or hMSCs (control: normoglycaemic, insulin content was 2.17 pmol/mg). (b) Pancreas from an MSC(−) mouse (normoglycaemic, insulin content was 0.41 pmol/mg). (c) Pancreas from an MSC(+) mouse (normoglycaemic, insulin content was 1.00 pmol/mg). (a–c) Upper panels: H&E staining. Middle panels: quadruple immunofluorescence staining for DAPI (light blue), insulin (red), CD3 (blue) and Mac-2 antigen (green), and their merge. Lower panels: quadruple immunofluorescence staining for DAPI, insulin, CD3 and CXCL9 (green), and their merge. The upper to lower panels are 2 μm serial sections. Scale bars, 200 μm. (d–f) Comparison of the immunostaining-positive area of the pancreas between groups. (d) CD3-positive area. (e) Mac-2 antigen-positive area. (f) CXCL9-positive area [control group islets: n=15; MSC(−) group islets: n=15; MSC(+) group islets: n=15]. Data are shown as the mean ± SEM. *p˂0.05; ***p˂0.001 between the indicated two groups by Student’s t test

