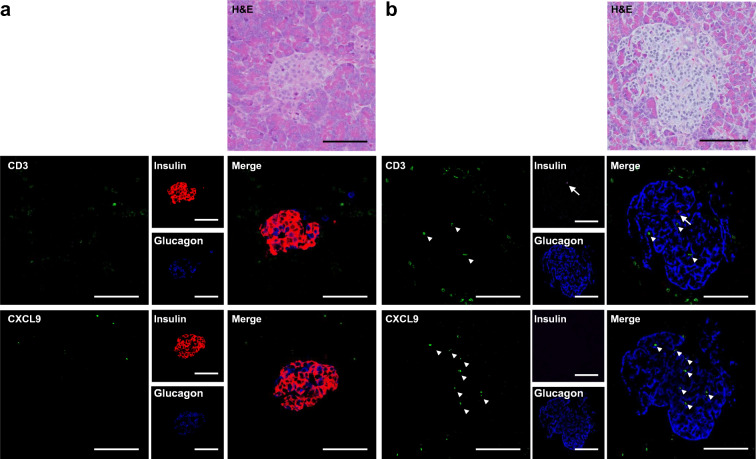
Fig. 5.
Representative immunostaining images of the pancreases of a control patient and the patient who developed type 1 diabetes after administration of ICIs. (a) Pancreas from a control patient. (b) Pancreas from the patient who developed type 1 diabetes after administration of ICIs. (a, b) Upper panels: H&E staining. Middle panels: triple immunofluorescence staining for CD3 (green), insulin (red) and glucagon (blue), and their merge. Lower panels: triple immunofluorescence staining for CXCL9 (green), insulin, and glucagon, and their merge. The upper to lower panels are 2 μm serial sections. The arrows indicate insulin and the arrowheads indicate CD3 or CXCL9. Scale bars, 100 μm

