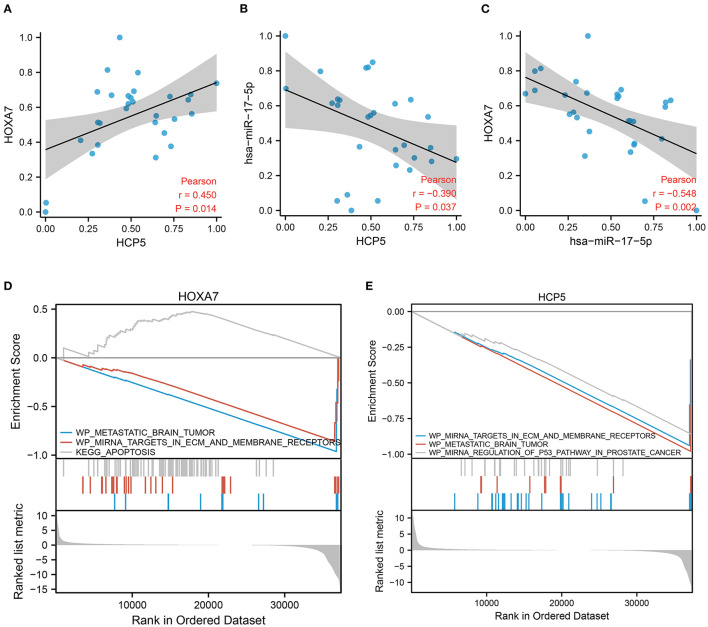
Figure 6.
Validation of the HCP5 /hsa-miR-17-5p/HOXA7 pathway using GSEA and correlation analysis. (A) A positive correlation between the expression of HOXA7 and HCP5 in clinical cohort samples (Pearson r = 0.45, p = 0.014). (B) The expression of hsa-miR-17-5p and HCP5 was negatively correlated (r = −0.39, p = 0.037). (C) The expression of HOXA7 and hsa-miR-17-5p was negatively correlated (Pearson r = −0.548, p = 0.002). (D,E) GSEA demonstrates pathways involving HOXA7 and HCP5.

