Figure 3.

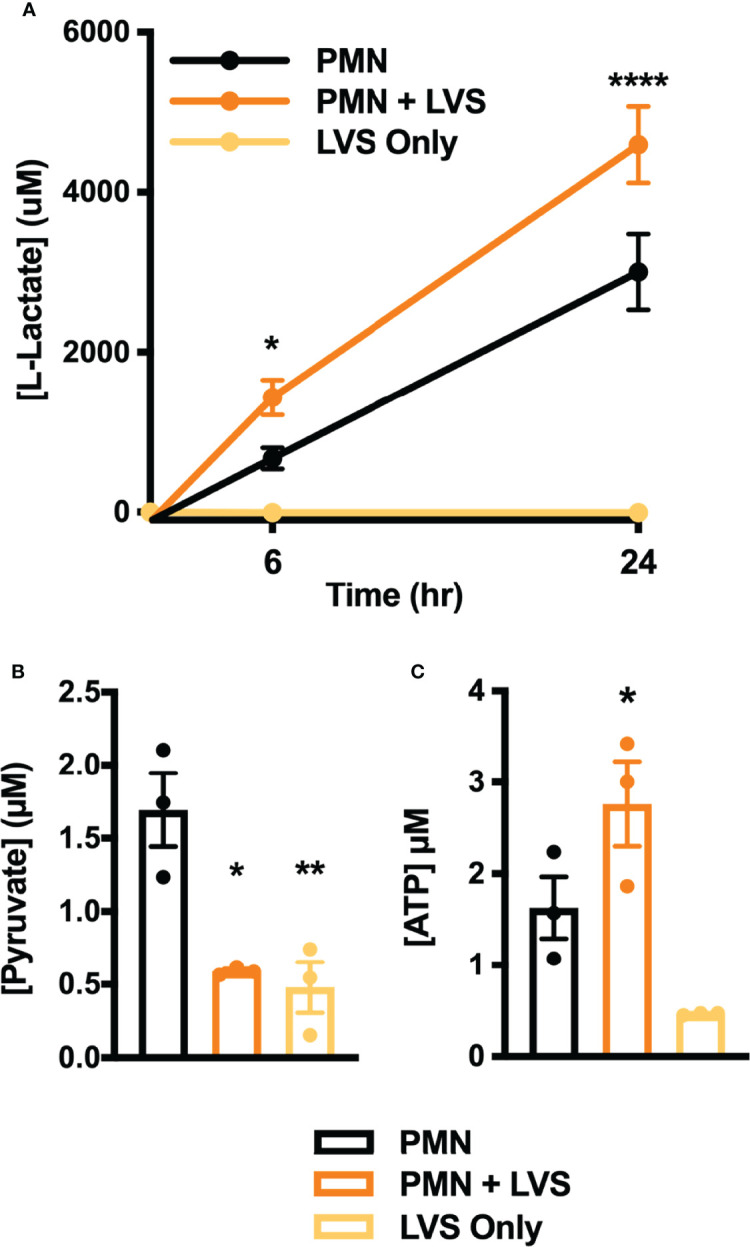
Differential effects of LVS on PMN lactate, ATP, and pyruvate. (A) Amount of lactate released by control and infected PMNs or LVS alone at 0, 6 and 24 hpi, n=3-4. ****p < 0.0001, *p < 0.05 vs. uninfected control cells at the indicated time points. (B, C) Pyruvate (B) and ATP (C) levels of control and infected PMNs or LVS alone at 24 hr, n=3. *p < 0.05, **p < 0.01 vs. control PMNs as indicated.
