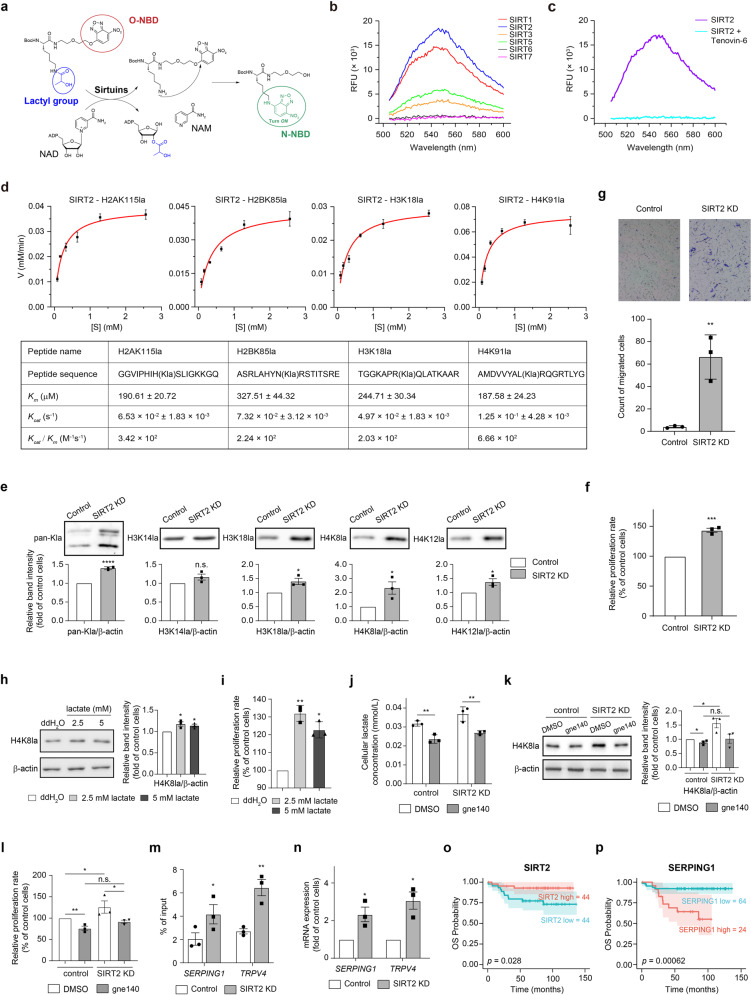
Fig. 1. SIRT2 functions as an eraser of histone lactylation in neuroblastoma cells and increased histone lactylation promote cell proliferation and migration.
a Schematic illustration of screening for the delactylase activity of sirtuins using a fluorescence probe. In the probe, NBD is covalently linked to an oxygen atom; when the lactyl group is removed (for example by some tested sirtuin proteins), the free amine group of lysine residue attacks the O-linked NBD group, and covalent linkage of the NBD group with a nitrogen atom turns on the fluorescence signal. The lactyl group is colored blue. The O-NBD group is indicated by a red circle. The N-NBD is colored green to indicate the fluorescence signal and is marked by a green circle. b Fluorescence assay of the probe with the indicated sirtuin proteins (λex = 480 nm, λem = 545 nm). c Fluorescence assay of the probe with SIRT2 (λex = 480 nm, λem = 545 nm) in the presence of the inhibitor Tenovin-6 (500 μM). d Michaelis-Menten plots for SIRT2 against the four peptides bearing H2AK115la, H2BK85la, H3K18la, or H4K91la modifications, respectively. The sequence of the peptides and kinetic parameters Km, Kcat, and Kcat/Km are shown in the tables. e Pan and histone lactylation levels at the H3K14, H3K18, H4K8, and H4K12 sites in SIRT2 knockdown (KD) SH-SY5Y cells, as detected by immunoblotting. f Cell proliferation rate of SIRT2 KD cells was significantly increased, as measured using a BrdU assay (chemiluminescent). g Cell migration capacity of SIRT2 KD cells was significantly increased, as evaluated using Transwell assays. The number of stained cells which migrated to the lower chamber was counted using ImageJ. h Histone lactylation levels at the H4K8 site in SH-SY5Y cells upon lactate treatment, as detected by immunoblotting. i Cell proliferation rate of SH-SY5Y cells was significantly increased upon lactate treatment, as measured using a BrdU assay (chemiluminescent). j Intracellular lactate concentration of control or SIRT2 KD SH-SY5Y cells upon LDHA inhibitor gne140 treatment (10 μM), as detected by ELISA. k Histone lactylation levels at H4K8 site in control or SIRT2 KD cells upon LDHA inhibitor gen140 treatment (10 μM), as detected by immunoblotting. l Cell proliferation rate of control or SIRT2 KD cells upon LDHA inhibitor gen140 treatment (10 μM), as measured using a BrdU assay (chemiluminescent). m ChIP was performed with an anti-H4K8la antibody in control and SIRT2 KD cells. qPCR analysis of the ChIP precipitates was performed to assess the occupancy of H4K8la marks at the promoters of SERPING1 and TRPV4 genes shown to regulate tumor cell proliferation and migration. n qPCR analysis of SERPING1 and TRPV4 expression in control and SIRT2 KD cells. o, p The protein levels of SIRT2 (o) and SERPING1 (p) were quantified by mass spectrometry, and Kaplan–Meier (K-M) analysis of their levels with overall survival (OS) was conducted using the R package “survival”. The optimal cut-off value of each protein for the K-M plots was calculated using the “survminer” package. The SIRT2 KD cell line in the present figure refers to the SIRT2 KD-1 cell line in Supplementary Fig. S3. The complete data sets of SIRT2 KD cell lines with two shRNA are presented in Supplementary Fig. S3. The relative intensity of each band was quantified via densitometry, using ImageJ after normalization to β-actin, with the values expressed as the fold change versus the value detected for control SH-SY5Y cells. All data are presented as the means ± SEM, calculated from three independent experiments. *P < 0.05; **P < 0.01; ***P < 0.001; ****P < 0.0001; n.s., not significant as calculated by two-tailed student’s t-test.

