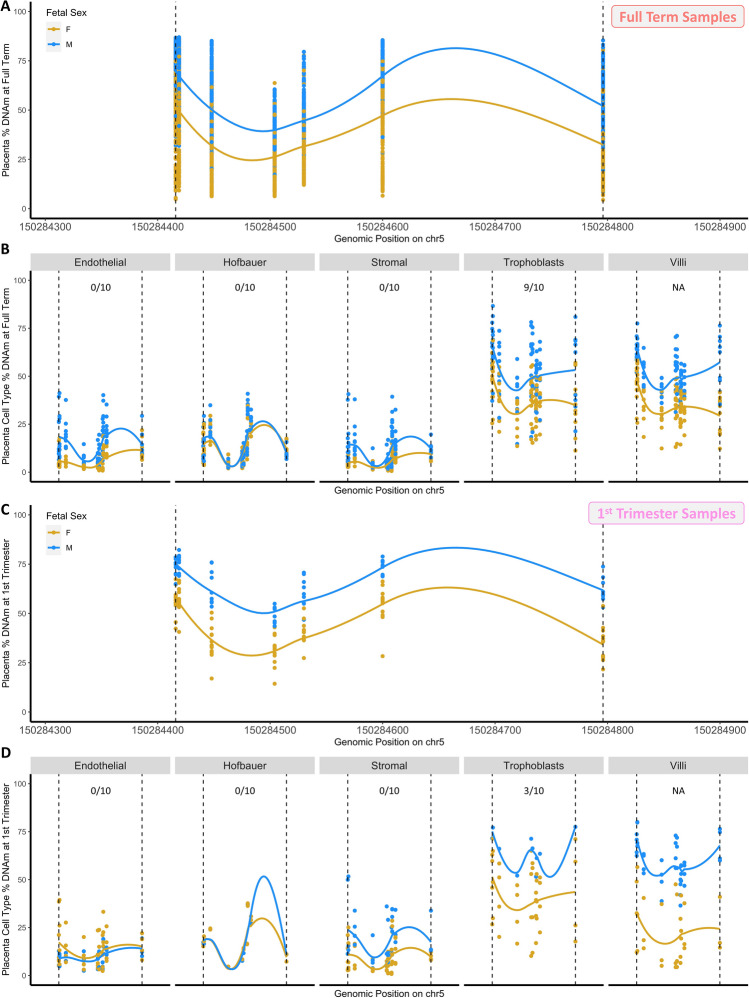
Figure 5.
Cell type heterogeneity at the ZNF300 promoter. DMRs are plotted as percent methylation as a function of genomic position. Dots indicate samples and solid lines indicate smooth lines through male sample values (blue) and female sample values (gold). Actual identified DMR region indicated via dashed lines. (A) DMR identified at ZNF300 promoter on chromosome 5 in full term analysis, plotted using full term samples from present study. (B–D) The same region, but plotted using samples from different datasets. (B) Term samples and individual placenta cell types from Yuan et al. (C) 1st Trimester samples from present study. (D) 1st trimester samples and individual placenta cell types from Yuan et al. In b + d, fractions indicate the proportion of probes in the region that were annotated by Yuan et al. as distinguishing that cell type in full term and 1st trimester samples, respectively. Villi samples were not evaluated in this manner by Yuan et al. as this is the unsorted bulk tissue.

