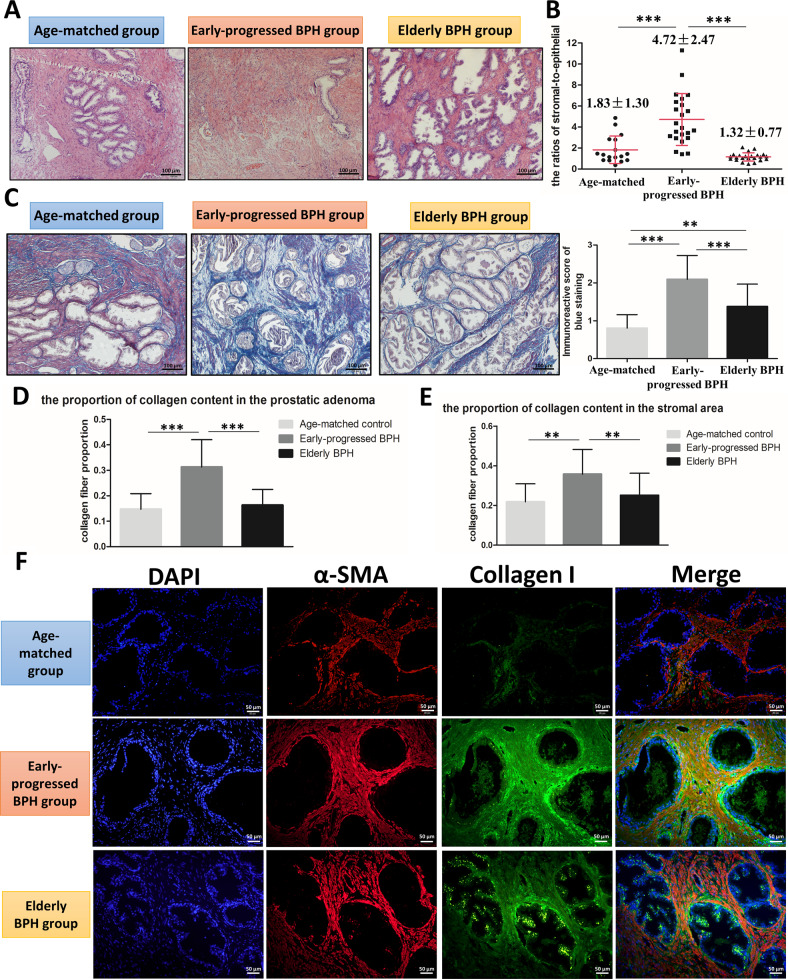
Fig. 1. Histological analysis of prostatic specimens from the three groups.
A H&E staining of paraffin-embedded prostatic tissue specimens from the three groups of patients. Scale bar: 100 μm. B Computer image analysis for the ratio of stromal-to-epithelial hyperplasia in the three groups. The variance was similar between the groups. ***P < 0.001. C Masson’s trichrome staining for prostatic tissue specimens from the patients of three groups. Scale bar: 100 μm. Right bar graph is the IOD of collagen fiber with blue staining. The variance was similar between the groups. **P < 0.01, ***P < 0.001. D, E Computer image analysis of Masson’s trichrome staining and the ratio of the stromal-to-epithelial area. The proportion of collagen fiber in the total prostatic adenoma (D) and in the stromal area (E) of the three groups. The variance was similar between the groups. **P < 0.01, ***P < 0.001. F Prostatic tissues from the three groups of patients were stained for α-SMA (red) and collagen I (green), and the nuclei were counterstained with DAPI (blue) by immunofluorescence. Merged images indicate a myofibroblastic phenotype. Scale bar: 50 μm.

