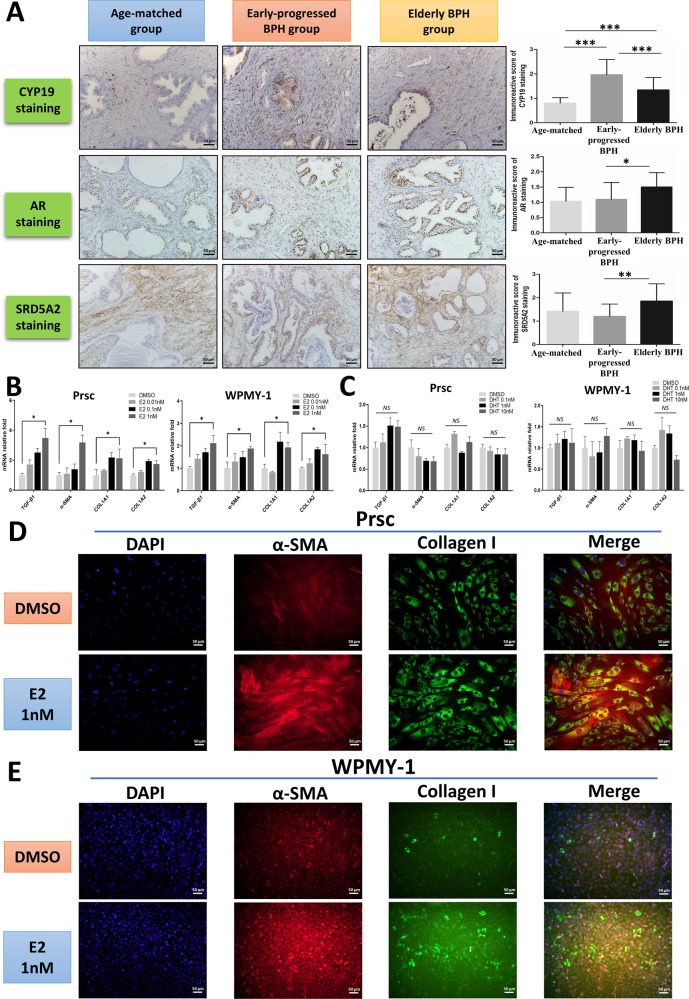
Fig. 2. Increased estrogen promotes prostatic fibrosis in early-progressed BPH patients.
A IHC staining for SRD5A2, AR, and CYP19 in the prostatic tissue specimens from the three groups. Scale bar: 50 μm. Right bar graph is the IOD of positive SRD5A2, AR, and CYP19 staining. The variance was similar between the groups. *P < 0.05, **P < 0.01, ***P < 0.001. B, C Prsc and WPMY-1 were treated with E2 (B) at 0 nM (DMSO), 0.01 nM, 0.1 nM, and 1 nM, or with DHT (C) at 0 nM, 0.1 nM, 1 nM, and 10 nM for 48 h. Q-PCR analysis was used to detect the expression of TGF-β1, α-SMA, COL1A1, and COL1A2. The variance was similar between the groups. *P < 0.05; NS non-significant. D, E Immunofluorescence staining for α-SMA, collagen I, and DAPI in Prsc (D) and WPMY-1 (E) with or without 1 nM E2 treatment for 72 h. Merged images indicate a myofibroblastic phenotype. Scale bar: 50 μm.

