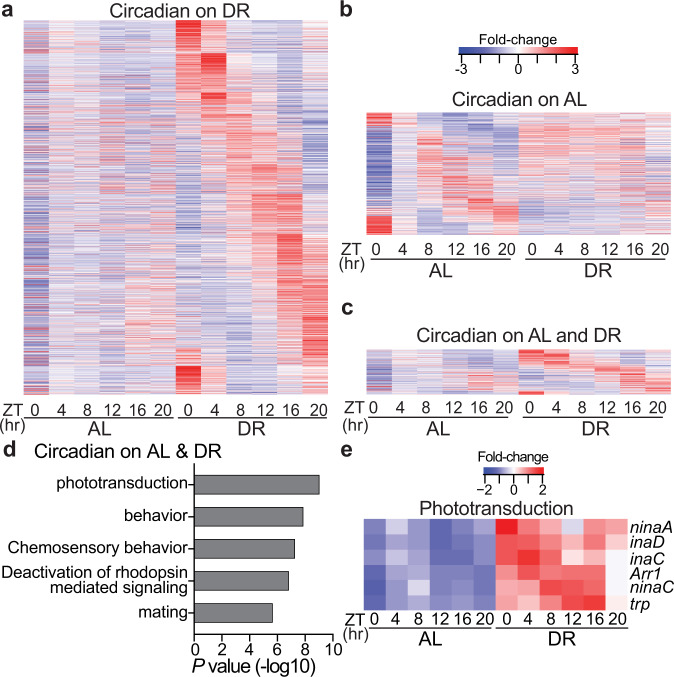
Fig. 1. Dietary restriction amplifies circadian transcriptional output and rhythmicity of phototransduction genes.
a–c Circadian transcriptome heatmaps for Canton-S flies representing 24 h expression plots for transcripts that cycle only on DR (a, n = 1487 transcripts), only on AL (b, n = 548 transcripts), or on both diets (c, n = 259 transcripts). Circadian transcripts plotted here are defined as having JTK_CYCLE P ≤ 0.05 (non-adjusted, non-rhythmic [P ≥ 0.05] in tim01 mutants) and are plotted by phase. d Gene-ontology enrichment categories corresponding to transcripts that cycle on both AL and DR diets. P-values were calculated with hypergeometric distribution (findGO.pl, HOMER) with no adjustment for multiple-hypothesis testing. e Heatmap of phototransduction transcript expression on AL and DR.

