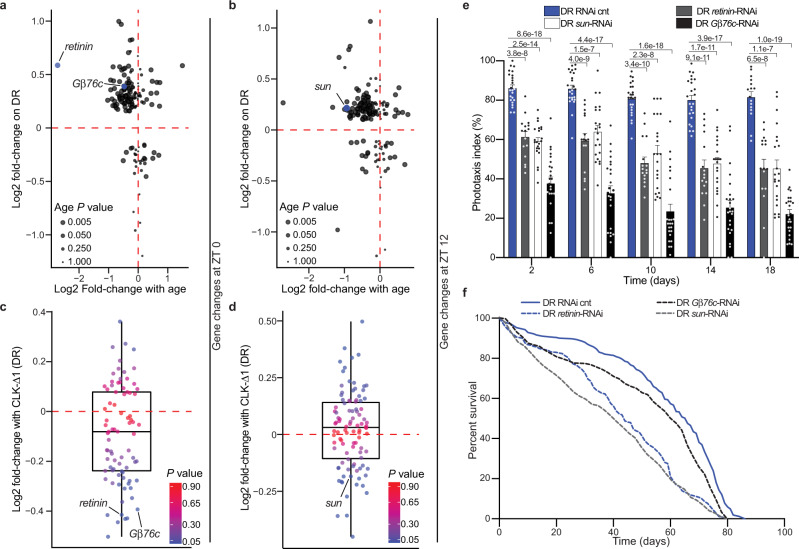
Fig. 6. Knockdown of DR-sensitive, eye-specific CLK-output genes reduces survival.
a, b Scatterplot of circadian, photoreceptor-enriched gene changes with age in wild-type heads (x-axis: 5- vs 55-day old flies) vs diet-dependent gene expression changes in heads from nCLK-Δ1 RNA-Seq control flies (y-axis: DR- vs AL-minus RU486) at ZT 0 (a) and ZT 12 (b). Age P-values (non-adjusted) were originally reported in ref. 16 and were calculated with Cuffdiff comparing transcript expression at day 5 to day 55 in wild-type Canton-S heads. c, d Boxplots of the expression changes in nCLK-Δ1 heads (DR plus- vs DR minus-RU486) at ZT 0 (c) and ZT 12 (d) of genes that were downregulated with age and upregulated on DR (upper left quadrants of panels a, b). The horizontal line within each box is the median, the bottom and top of the box are lower and upper quartiles, and the whiskers are minimum and maximum values. P-values (non-adjusted) were calculated with DESeq2 comparing transcript expression between controls and nCLK-Δ1 flies reared on DR. e Positive phototaxis responses with eye-specific knockdown of Gβ76c (GMR-GAL4 > UAS-Gβ76c-RNAi), retinin (GMR-GAL4 > UAS-retinin-RNAi), and sun (GMR-GAL4 > UAS-sun-RNAi) compared to RNAi control flies (GMR-GAL4 > UAS-mCherry-RNAi) reared on DR. For each timepoint results are represented as mean values of phototaxis responses ±SEM (RNAi control n = 24 biologically independent cohorts of 20 flies examined over three independent experiments, N = 480 flies per condition; Gβ76c-RNAi n = 24 biologically independent cohorts of 20 flies examined over three independent experiments, N = 480 flies per condition; retinin RNAi n = 16 biologically independent cohorts of 20 flies examined over two independent experiments, N = 320 flies per condition; sun RNAi n = 24 biologically independent cohorts of 20 flies examined over three independent experiments, N = 480 flies per condition) P-values were determined by two-tailed Student’s t-test (unpaired) at each timepoint comparing the phototaxis index of RNAi control flies to Gβ76c-, retinin-, and sun-RNAi flies. f Survival analysis of eye-specific Gβ76c, retinin, sun, and RNAi knockdown flies compared to RNAi control flies reared on DR. Survival data are plotted as an average of three independent lifespan repeats for RNAi control, sun, and Gβ76c flies and two independent lifespan repeats for retinin RNAi knockdown flies. RNAi-cnt flies: N = 490; retinin-RNAi flies: N = 363; sun-RNAi flies: N = 468; Gβ76c-RNAi flies: N = 509. Source data are provided as a Source Data file.

