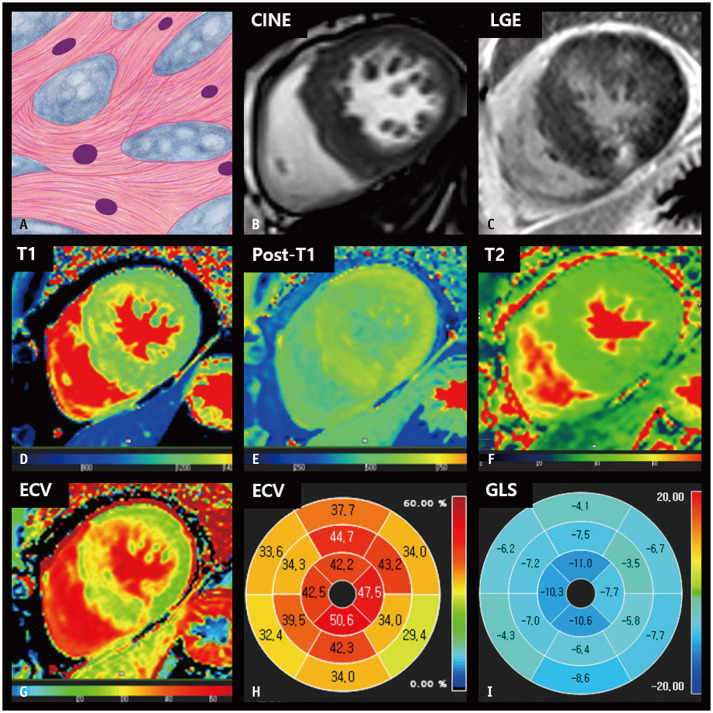
Fig. 2. CMR findings of HCM based on histologic features.
A. A schematic illustration of representative histological findings of HCM includes cardiomyocyte hypertrophy with a disorganized arrangement of fibers and interstitial fibrosis. Variations in muscle fiber thickness and enlarged and hyperchromatic nuclei are characteristic features. B. On short-axis cine images of the end-diastolic phase, the LV wall is thickened, measuring 18 mm. C. LGE imaging reveals patchy hyperenhancement in a thickened myocardium, which correlates histologically with regions of fibrosis. D. The native T1 map shows heterogeneous native T1 values of the myocardium, measuring up to 1320 ms on 3T MRI. E. After contrast media injection, the myocardium showed patchy areas with decreased post-T1 values. F. The T2 map shows increased T2 values of thickened myocardium, measuring up to 45 ms on 3T MRI. G, H. The ECV fraction map (G) and bull’s eye diagram (H) demonstrate increased ECV of the myocardium, up to 50.6%. I. A bull’s eye polar map of the GLS measured on cine images shows decreased absolute strain values in each myocardial segment. CMR = cardiac magnetic resonance, ECV = extracellular volume, GLS = global longitudinal strain, HCM = hypertrophic cardiomyopathy, LGE = late gadolinium enhancement, LV = left ventricular

