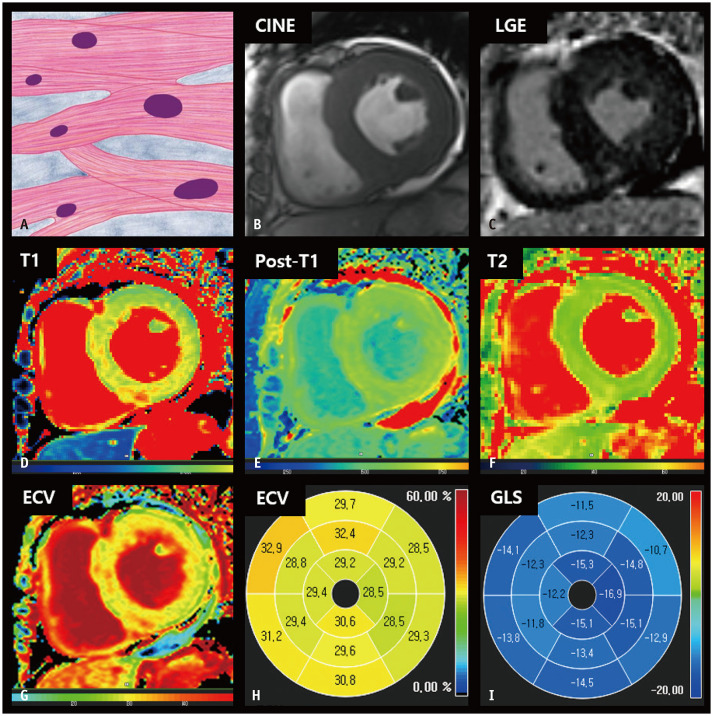
Fig. 3. CMR findings of hypertensive heart disease based on histologic features.
A. A schematic illustration of representative histological findings of hypertensive heart disease indicates that cardiomyocytes are hypertrophied with preserved parallel alignment. The intermuscular space is widened, and interstitial and perivascular fibrosis can be observed. B. On the short-axis cine image of the end-diastolic phase, the LV myocardium is concentrically thickened, measuring up to 17 mm. C. LGE image shows focal hyperenhancement at the right ventricular insertion points. D. The native T1 map shows slightly increased native T1 values of the LV septum, measuring up to 1286 ms on 3T MRI. E. On the post-contrast T1 map, the myocardium shows homogenous post-T1 values. F. The T2 map shows even T2 values. G, H. The ECV fraction map (G) and bull’s eye diagram (H) demonstrate a slightly increased ECV fraction of the myocardium, up to 32.9%. I. A bull’s eye polar map of the GLS measured on cine images shows relatively preserved LV strain values in each myocardial segment. CMR = cardiac magnetic resonance, ECV = extracellular volume, GLS = global longitudinal strain, LGE = late gadolinium enhancement, LV = left ventricular

