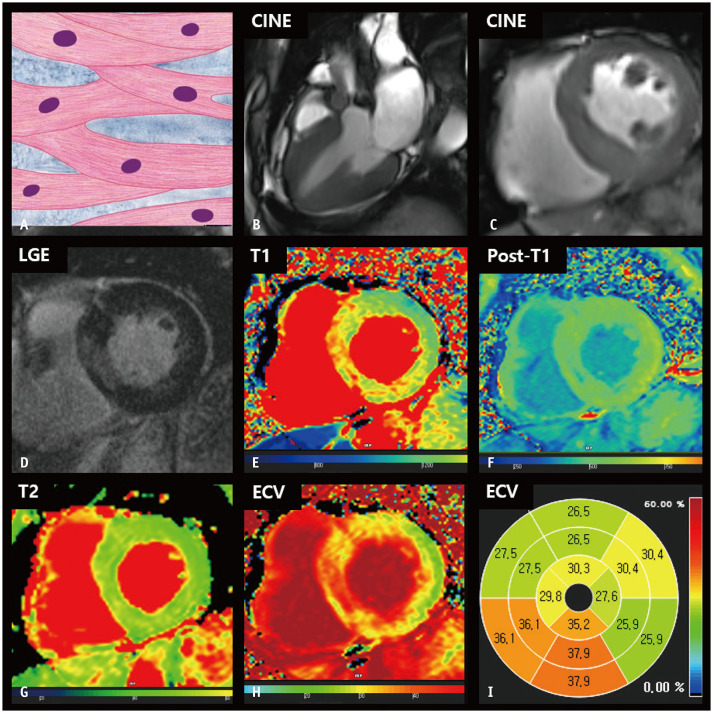
Fig. 4. CMR findings of aortic stenosis based on histologic features.
A. A schematic illustration of representative histological findings in aortic stenosis shows that cardiomyocytes are thickened and nuclei are enlarged with preserved muscle fiber alignment. B. Three-chamber cine image of the systolic phase shows thickened aortic valves with artifacts in the supra-valvular area. C. The left ventricular myocardium is concentrically thickened, measuring up to 18 mm on a short-axis cine image of the end-diastolic phase. D. LGE image reveals multifocal patchy myocardial scarring. E. The native T1 map shows increased native T1 values, measuring up to 1315 ms on 3T MRI. F. On the post-contrast T1 map, the myocardium shows heterogeneous post-T1 values with multifocal patchy foci and decreased T1 values. G. The T2 map shows relatively even myocardial T2 values. H, I. The ECV fraction map (H) and bull’s eye diagram (I) demonstrate an increased ECV fraction in the myocardium. CMR = cardiac magnetic resonance, ECV = extracellular volume, LGE = late gadolinium enhancement

