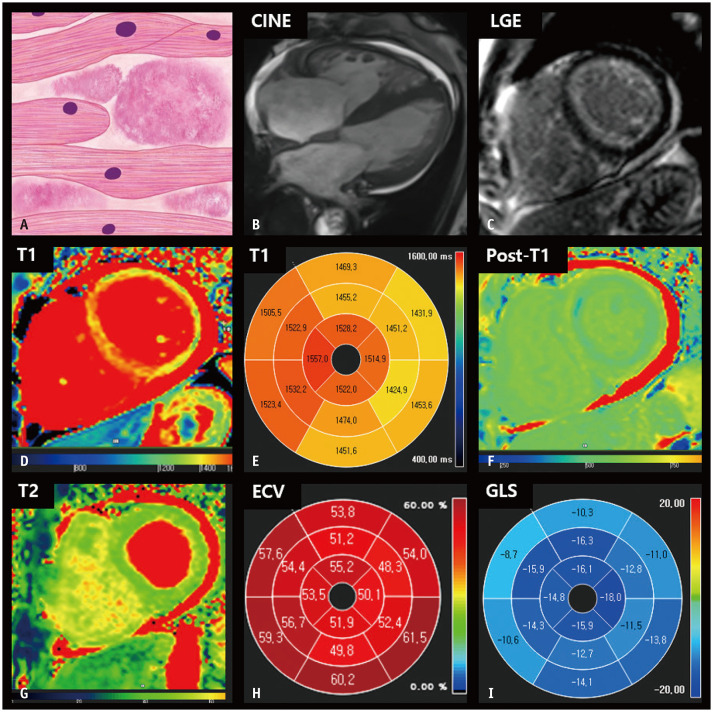
Fig. 6. CMR findings of immunoglobulin light-chain amyloidosis based on histologic features.
A. A schematic illustration of representative histologic findings of cardiac amyloidosis showing interstitial deposits of amorphous material (amyloid). B. In the four-chamber cine image of the end-diastolic phase, diffuse LV and right ventricular wall thickening are observed. C. LGE image reveals diffuse circumferential LV subendocardial hyperenhancement. D, E. The native T1 map shows diffusely increased native T1 values in the myocardium. F. After contrast media injection, the myocardium demonstrates low subendocardial post-T1 values in the left ventricle. G. The T2 map shows diffusely increased T2 values in the myocardium, measuring up to 55 ms. H. The bull’s eye diagram of ECV fraction demonstrates a markedly increased ECV fraction of the myocardium, which is calculated to be up to 61.5%. I. A bull’s eye polar map of the GLS measured on cine images shows decreased ventricular strain values with relative apical sparing. CMR = cardiac magnetic resonance, ECV = extracellular volume, GLS = global longitudinal strain, LGE = late gadolinium enhancement, LV = left ventricular

