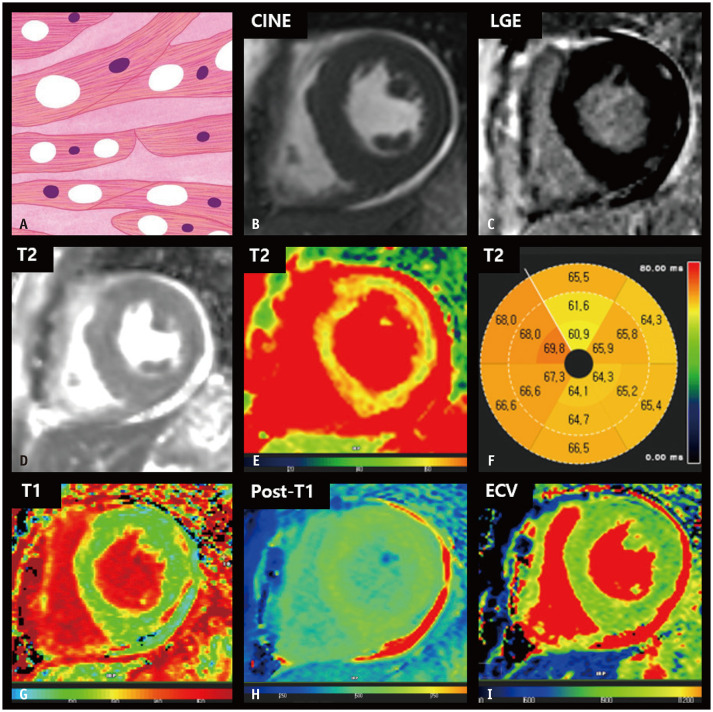
Fig. 7. CMR findings of mitochondrial cardiomyopathy based on histologic features.
A. A schematic illustration of the histological features of mitochondrial cardiomyopathy indicating myocyte hypertrophy with vacuolar changes. B. On short-axis cine image of the end-diastolic phase, the LV shows concentric wall thickening. C. LGE imaging reveals the absence of focal abnormal hyperenhancement in the LV. D-F. The T2 maps (D, E) and bull’s eye diagram (F) show diffusely increased T2 values of the myocardium, measuring up to 69.8 ms on 1.5T MRI. G. The native T1 map shows diffusely increased native T1 values of the myocardium, measuring up to 1150 ms on 1.5T MRI. H. After contrast media injection, the myocardium reveals homogeneous post-T1 values in the LV. I. The ECV fraction map shows normal LV ECV fraction. CMR = cardiac magnetic resonance, ECV = extracellular volume, LGE = late gadolinium enhancement, LV = left ventricular

