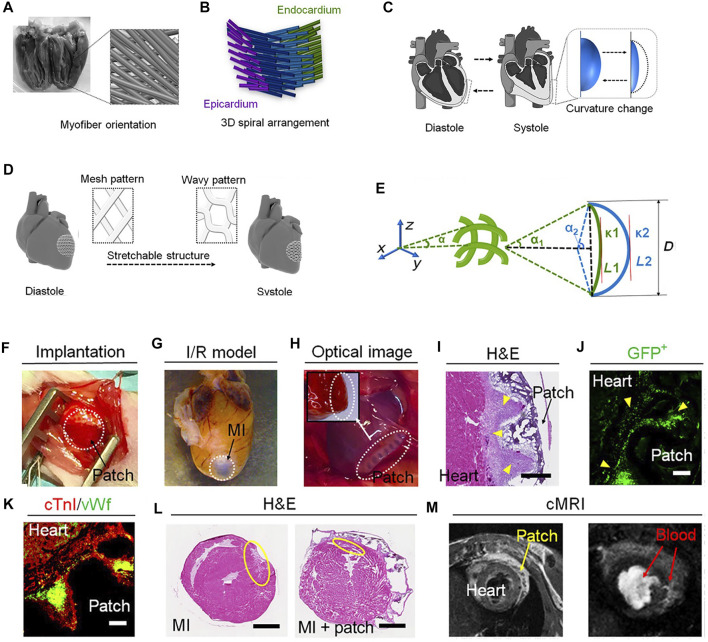
FIGURE 4.
Design, fabrication, and in vivo studies of 4D cardiac patches. (A) Myofiber orientation of the left ventricular wall from +60° to −60° which rotates (B) left-handed from epicardium to the right-handed in the endocardium. (C) Cardiac curvatures in diastole and systole. (D) CAD design of the 3D heart architecture during stretching. (E) Geometric model of fibers in printed patches in which α represents the angle and L the length of the fiber, D the special displacement, and κ 1 and 2 the ventricular curvature in systole and diastole, respectively. (F) Implanted 4D printed patch and (G) MI heart model after 4 months of implantation. (H) Firm attachment of an implanted cellularized patch after 3 weeks (I) H&E staining of the cellularized patch after 3 weeks of implantation indicating a high concentration of cells (yellow arrows and scale bar: 400 µm). (J) Fluorescent image of GFP + hiPSC-CMs after 3 weeks of implantation demonstrating high viability and engraftment (scale bar: 100 µm). (K) Immunofluorescence staining of cTnIand vWf verifying the presence of hiPSC-CMs and hECs on the cellularized patches after 3 weeks of implantation (scale bar: 100 µm). (L) Comparison of infarct size indicated by yellow circles, mouse model control (left, ∼ 8.4 ± 1.1%) and with patch implantation (right, ∼ 3.8 ± 0.7%) after 10 weeks. (M) MRI imaging of the heart with implanted patch after 10 weeks. Reproduced from Cui et al. (2020).

