Figure 3.
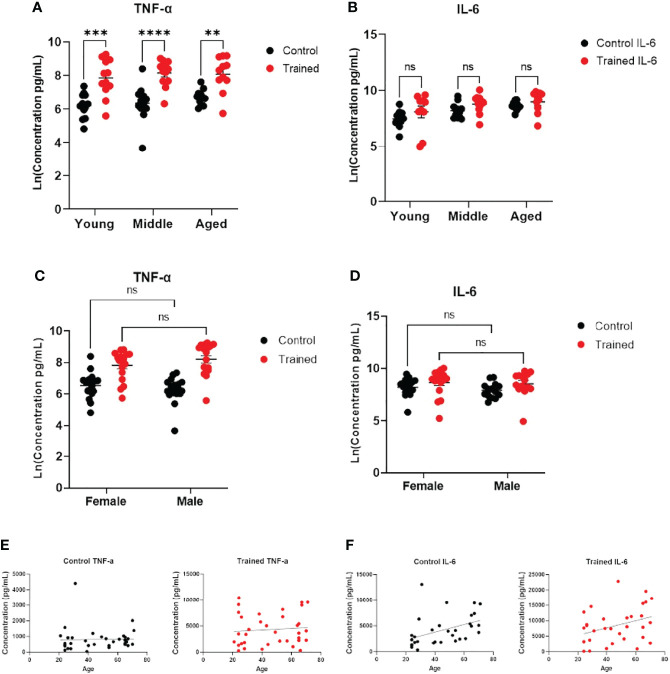
Immune training stimulated increased monocyte cytokine expression. (A) Scatter plot of TNF–α expression 7 days after β–glucan or PBS treatment, followed by LPS (N=11,12). TNF–α expression was below the limit of detection in trained and control monocytes that were not subsequently challenged with LPS. (B) IL–6 expression (N=10–12). IL–6 expression was limit of detection at baseline. (C) Scatter plot of TNF–α expression after LPS stimulation (10ng/mL) 7 days after β–glucan or PBS treatment (Female: N=18, Male: N=14). (D) IL–6 expression after LPS stimulation (Female: N=17, Male: N=14). (E) Scatter plot and simple linear regression of TNF–α expression by age in control and trained cells. Correlations are not significant (N=35). (F) Scatter plot and simple linear regression of IL–6 expression in trained and control cells. Control cells: R2 = 0.1792, P=0.0158 (N=32). Trained cells: R2 = 0.0.1203, P=0.0518 (N=32). A and B measured were analyzed with a mixed effect model and Šídák’s multiple comparisons test. C and D were analyzed by PERMANOVA for sex and training (**P ≤ 0.01, ***P ≤ 0.001, ****P ≤ 0.0001, ns, not significant).

