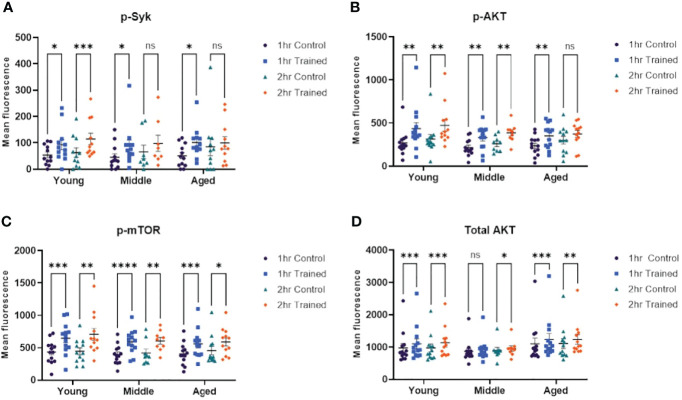
Figure 5.
Immune training activates intracellular signaling pathways in monocytes. (A) Scatterplot depicting phosphorylated–Syk 1 and 2 hours after β–glucan or PBS treatment (N=8–12). (B) Scatterplot depicting phosphorylated–AKT expression (N=9–13). (C) Scatterplot depicting phosphorylated–mTOR (N=9–13). (D) Scatterplot depicting total AKT expression (N=9–13). All results analyzed using a mixed–effect model and Šídák’s multiple comparisons test (*P ≤ 0.05, **P ≤ 0.01, ***P ≤ 0.001, ****P ≤ 0.0001, ns, not significant).

