Figure 1.
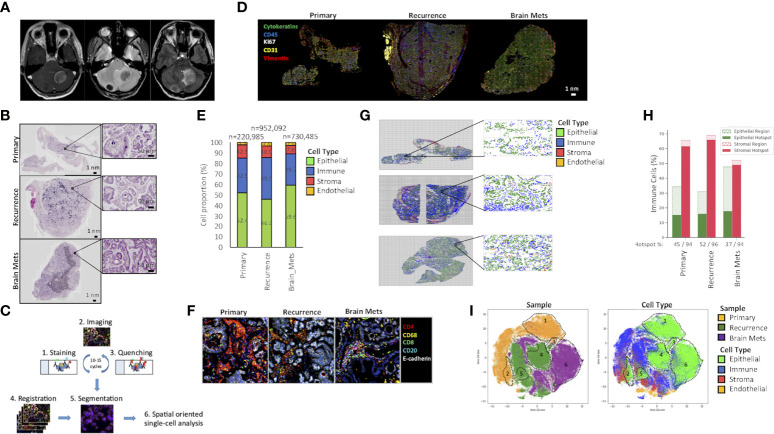
Tumor architecture and composition. (A) Brain mets magnetic resonance imaging (MRI). Axial T1 post contrast (left panel) showing two peripherally enhancing masses in the cerebellum. Axial T2* (center panel) demonstrates hypointensity within these masses, indicative of mineralization, and confirmed by hyperdensity on MRI. Axial FLAIR (right panel) with mild hyperintense edema surrounding these masses, particularly the large left cerebellar mass, with mild mass effect on the fourth ventricle. (B) H&E staining of the primary ovarian tumor, a pelvic recurrence, and brain mets. (C) Cyc-IF framework. For each sample, sequential cycles of staining, imaging, and quenching are performed on a single tissue slide. The images are then aligned through registration, and the segmentation is performed. After extracting the mean intensities of each marker in each cell, a spatially oriented single-cell analysis is performed. (D) Immunostaining of epithelial (E-cadherin, cytokeratins), endothelial (CD31), stromal (vimentin), and proliferative (Ki67) markers of the primary ovarian tumor, a pelvic recurrence, and brain mets. (E) Tumor composition. The Cyc-IF analysis allows the classification of all cells within epithelial, immune, stromal, and endothelial compartments. The histogram represents the percentage of epithelial, immune, stromal, and endothelial cells in each tumor sample. (F) Example of a region enriched in immune cells with the presence of immune “hot spots”. (G) Grid analysis. Each tissue analyzed by Cyc-IF was reconstructed using the x and y coordinates of the nucleus. A grid was used to analyze the proportion of each cell type in discrete regions of the tumors. (H) For each tumor, the immune cell distribution within the epithelial and stromal compartments was calculated based on the grid analysis. Cells found in aggregates were considered as part of an immune “hot spot”. (I) UMAP analysis performed on a subset of 200,000 cells randomly selected across each tumor. Colors represent the samples and the cell type. The full name of each protein can be found in Supplementary Table S1 .

