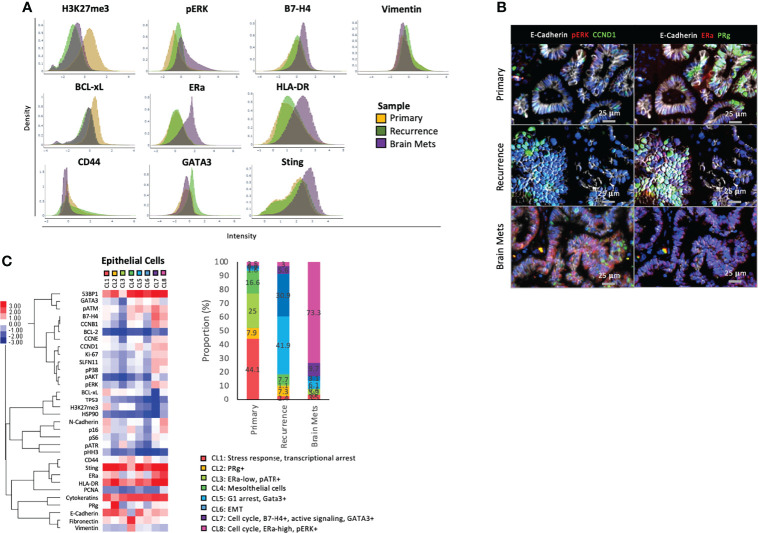
Figure 2.
Epithelial cell phenotype. (A) Density plot showing the distribution of expression of specific markers across epithelial cells from each sample. (B) Representative immunostaining of markers that are differentially expressed across samples. (C) A K-Mean clustering was performed on epithelial cells. The heat maps represent the median expression of each marker within each cluster (CL), and the phenotype of each cluster is annotated. The histogram represents the frequency of each cluster within the samples, and the cluster phenotypes are described below the histogram. The full name of each protein can be found in Supplementary Table S1 .

