Figure 4.
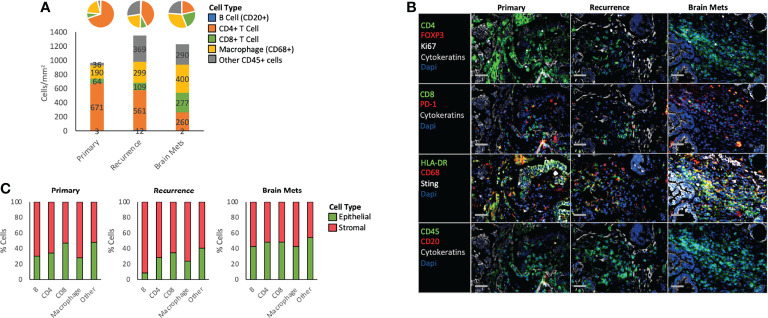
Immune phenotype. (A) Histogram and pie chart showing the density and the proportion of different immune cell populations across all samples. (B) Representative immunostaining of specific markers within each sample. (C) Proportion of each immune cell subtype in the epithelial and the stromal compartments. The percentages were calculated based on the grid analysis. The full name of each protein can be found in Supplementary Table S1 .

