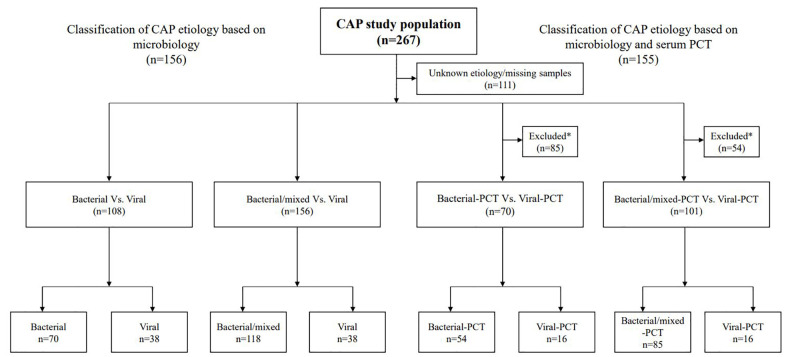
Figure 1.
Flow chart for classification of CAP etiology based on microbiological findings and PCT levels.
*Procalcitonin (PCT) levels with cut-off levels of 0.25 ng/mL were used to classify bacterial-PCT or bacterial/mixed-PCT CAP (⩾0.25 ng/mL) and viral-PCT CAP (<0.25 ng/mL) in combination with microbiological investigations. Patients who did not meet both the inclusion criteria were excluded from further analysis.

