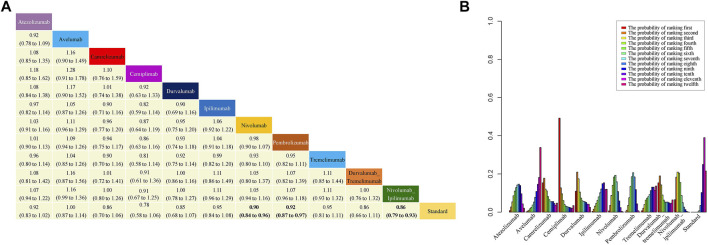
FIGURE 4.
Results of NMA, safety profile (A) and probability ranking diagram (B). In the safety profile, efficacy of treatment for overall survival (OS) is represented as HRs with 95% confidence intervals. All comparisons are made as column versus row. Statistically significant results are in bold. Probability ranking diagram shows the probability of the safety of different therapies ranking the first to the last for OS.

