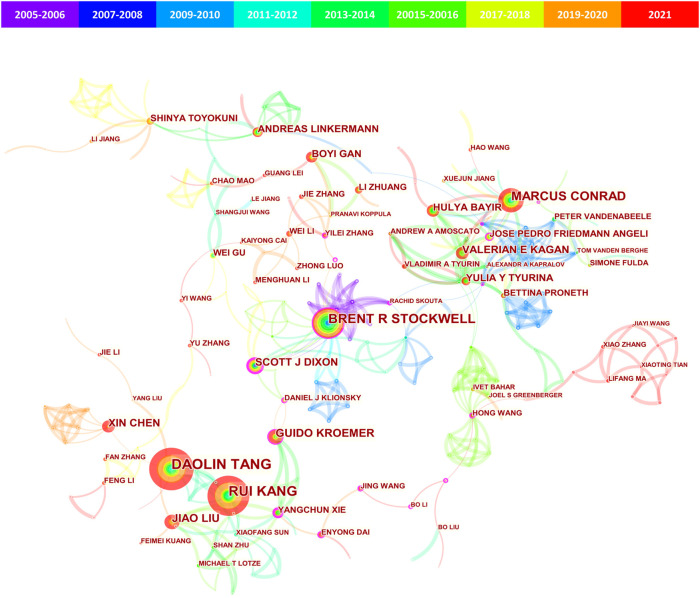
FIGURE 3.
CiteSpace visualization map of authors involved in ferroptosis in cancer. The nodes represent authors (the larger circle, the higher the number of publications); lines between the nodes represented a collaboration between two authors on the same article (the wider lines, the more frequency of collaborations); the colors in the nodes represented the years, and the purple ring represented high centrality (≥0.10).

