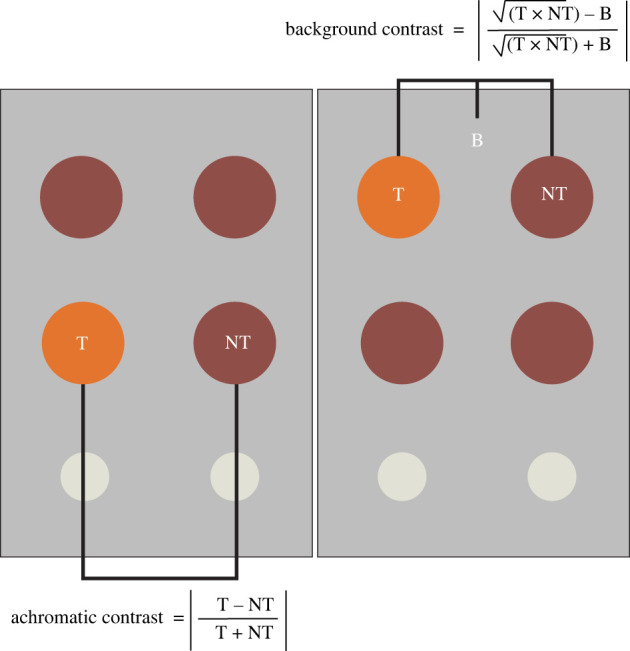
Figure 3.

Diagram of a foraging grid. Birds were presented with a foraging grid containing eight coloured stimuli. The two target stimuli (T) were a different colour than the six non-target stimuli (NT). All trials were repeated on three different backgrounds (B): black, white and grey. To calculate background contrast for our analyses, we took the geometric mean double cone catch from the target and non-target stimuli (given as the square root of the product of the two double cone catches) and used it and the double cone catch of the background to calculate Michelson contrast. The second value used in our models was the achromatic Michelson contrast between the target and non-target stimuli. (Online version in colour.)
