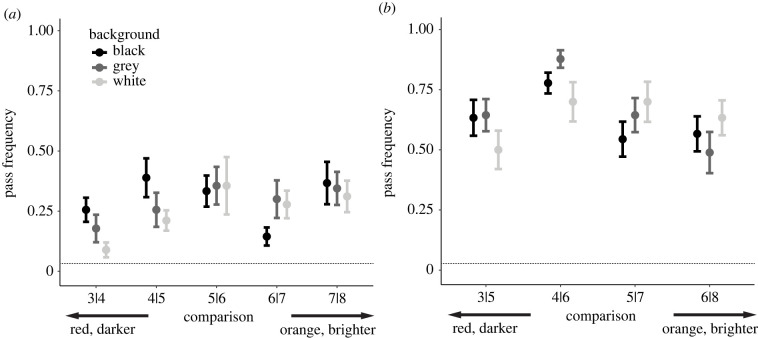
Figure 4.
Discrimination test results. Mean (+/− s.d.) pass frequency over 10 one-apart (a) and two-apart (b) discrimination trials per bird. Results are segmented by the background and, generally, pass frequencies for darker colours are lower on brighter backgrounds, and vice-versa. The dotted line on both graphs represents the expected pass frequency if birds chose stimuli randomly (1 in 24).

