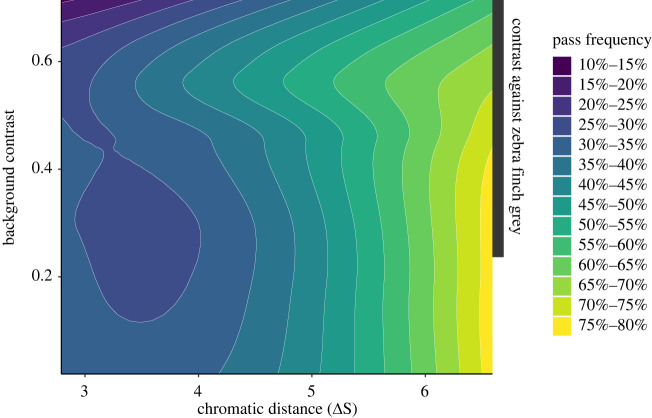
Figure 5.
Model predictions of pass frequency. Using a LOESS model [23] to predict pass frequency as a function of background contrast (the achromatic Michelson contrast between the target stimuli and background) and chromatic distance between the colour stimuli, we see that high background contrast (greater than 0.6) reduces predicted pass frequency for a given chromatic distance, particularly when the chromatic distance is small. The dark grey box represents the range of background contrast values that the Munsell colours used in this experiment would produce against the grey colour of male zebra finches. (Online version in colour.)

