Figure 2.
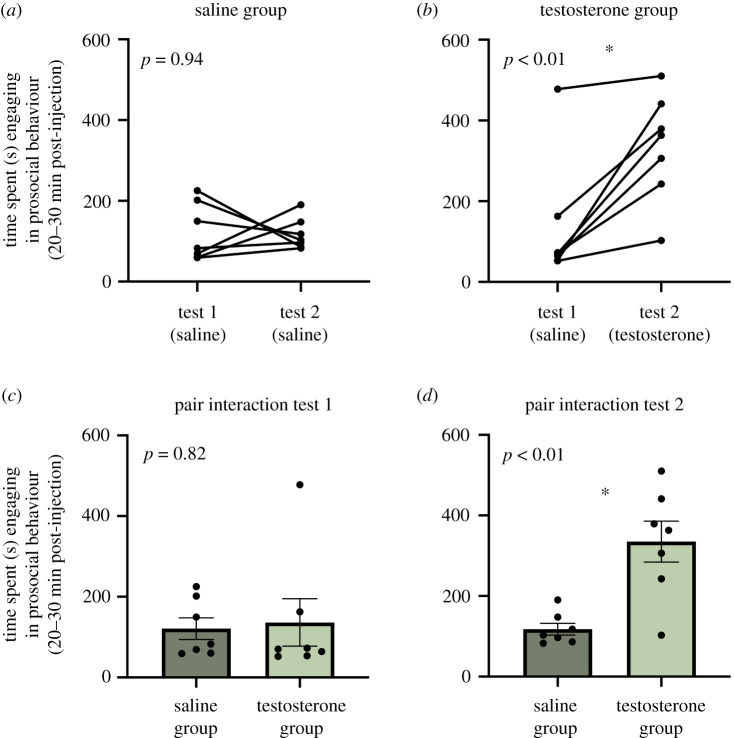
Pair interaction test. (a) Males in the saline group show no difference in prosocial behaviour from test 1 to test 2. (b) Males in the testosterone (T) group show an increase in prosocial behaviour from test 1 to test 2 after receiving a T injection. (c) For test 1, the amount of prosocial behaviour exhibited by the saline and T groups did not differ. (d) For test 2, males in the T group were significantly more prosocial than males in the saline group. An asterisk indicates statistical significance (p < 0.05).

