Figure 2.
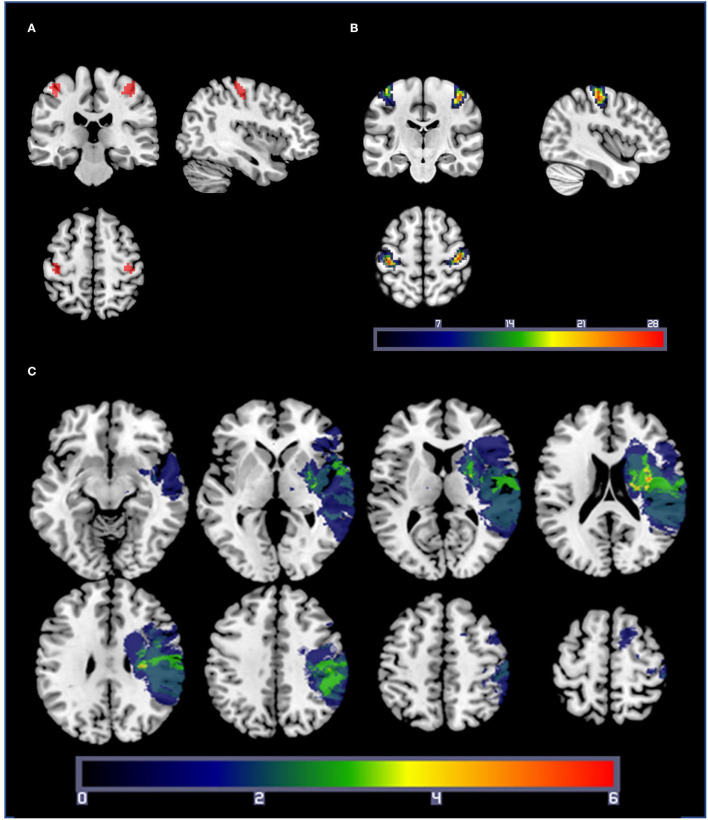
(A) A representative set of M1 ROIs from a healthy control participant, based on the comparisons of right-hand movement > rest and left-hand movement > rest from the hand localizer scan. Statistical thresholds were set on an individual basis to identify a cluster of 50 contiguous voxels centered in M1 for each participant. (B) ROI overlap map: Summation of M1 ROIs for each participant (healthy controls and patients with stroke). Warmer colors indicate a voxel is included in more ROIs. ROIs were densely clustered over the posterior aspect of the precentral gyrus including the hand knob and the central sulcus. (C) Lesion overlap map: lesion masks from the 19 patients with stroke projected into standard space. Lesions from the right hemisphere were flipped across the sagittal axis for illustration purposes only. Warmer colors indicate a voxel is present in more participants' lesion masks.

