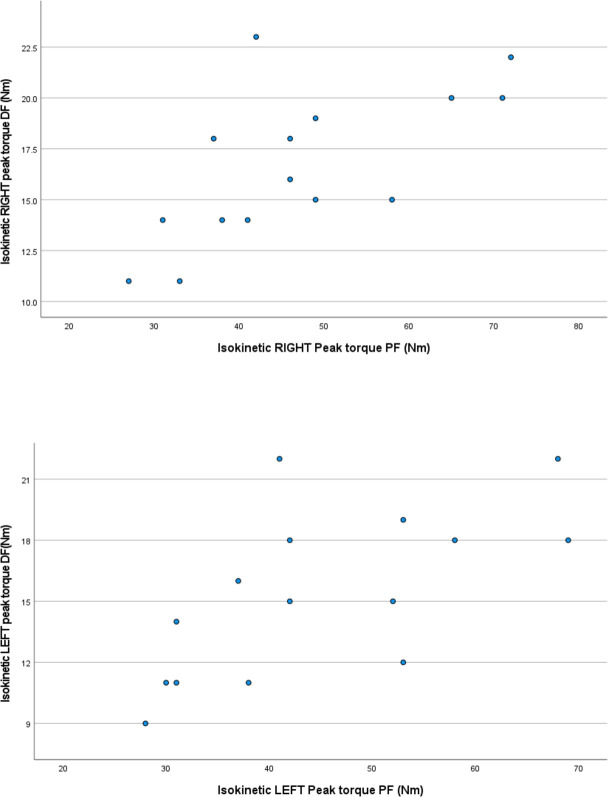
Figure 3.
(A) Scatterplot depicting the correlation between right isokinetic peak torque of the DFs and right isokinetic peak torque of the PFs (B). Scatterplot depicting the correlation between left isokinetic peak torque of the DFs and left isokinetic peak torque of the PFs. DF, dorsiflexor; PF, plantar flexor.

