
Figure 4. Contribution of GSDMD in the effect of VHHASC on the release of IL‐1β and cell death induced by PFO or nigericin.
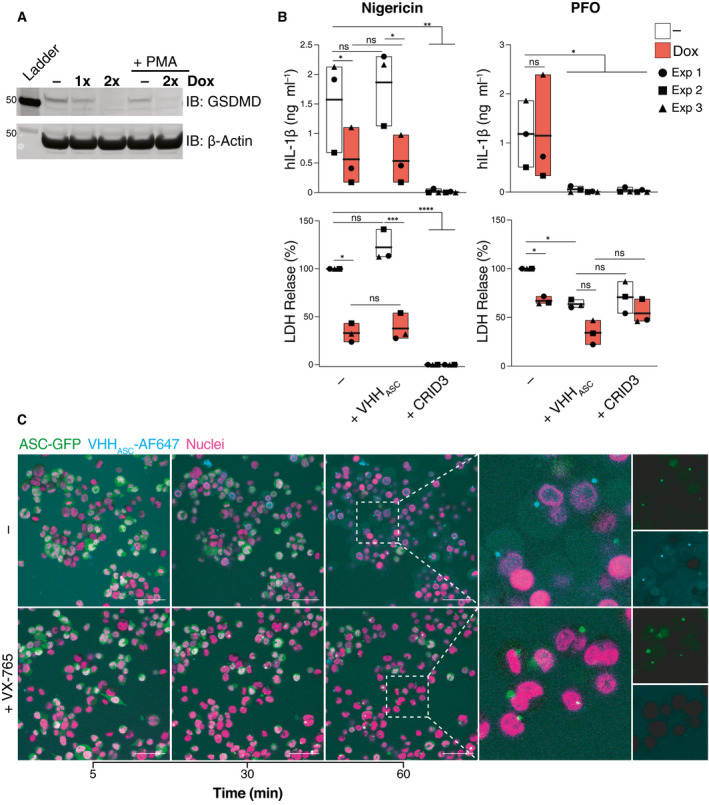
THP‐1 cells expressing a Dox‐inducible CRISPR‐Cas9 cassette targeting GSDMD were left untreated (–), or treated with 1 µg ml−1 Dox for one or two cycles of 72 h (1×, or 2× respectively).
- Immunoblot analysis of GSDMD expression following the indicated course of Dox treatment and PMA‐differentiation, as indicated. Data is from one representative of two independent experiments.
- IL‐1β concentration or percentage of LDH released into cell‐free supernatants of PMA‐differentiated THP‐1 cells that were treated with VHHASC (200 µg ml−1) or CRID3 (25 µM) for 30 min prior to stimulation with nigericin (10 µM, left panels) or PFO (30 ng ml−1, right panels) for 2 h. Data is average of experimental duplicates from three independent experiments, each represented by a different symbol. ns P > 0.05; *P < 0.05; **P < 0.01; ***P < 0.001; ****P < 0.0001, Two‐way ANOVA, multiple comparison (Tukey test). Data is displayed as floating bars with the max/min values and mean (thicker band).
- Live confocal imaging of PMA‐differentiated and nigericin‐treated (10 µM) THP‐1 cells expressing human ASC‐GFP (green) in the presence of AlexaFluor647‐labeled VHHASC (VHHASC‐AF647, 10 µg ml−1, cyan) in the medium. Cells were either left untreated (–) or incubated with VX‐765 (50 µM) for 1 h prior to nigericin stimulation. Nuclei were stained with Hoechst 34580 (magenta). Scale bar: 50 µm. Data is from one representative out of two independent experiments.
Source data are available online for this figure.