
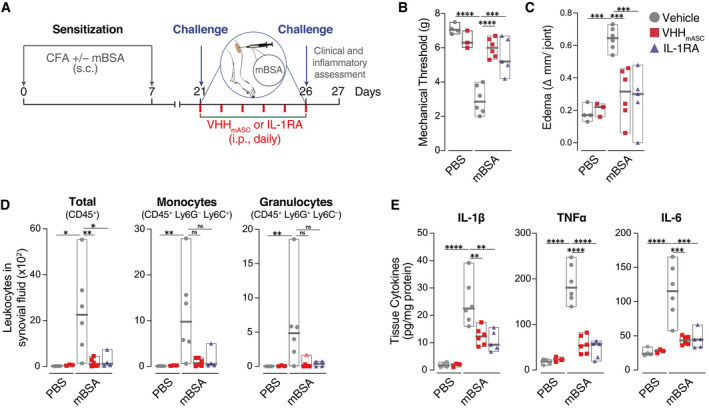
Figure 7. VHHmASC ameliorates antigen‐induced arthritis.
-
ASchematic representation of the experimental setting used for the mBSA‐induced arthritis model. Mice were injected sub‐cutaneously (s.c.) with mBSA (500 µg/animal) in an emulsion containing 1 mg ml−1 Freund’s adjuvant on day 0 and day 7. Control mice received injections lacking mBSA. Mice were then immunized with an intra‐articular injection of mBSA (100 µg, right knee) on days 21 and 26. From day 21 until day 26, mice were treated daily with an intra‐peritoneal (i.p.) injection of VHHmASC (5 mg kg−1), IL‐1RA (50 µg kg−1), or vehicle (PBS).
-
B, CMechanical allodynia threshold (B) and edema (C) were evaluated on day 27. Data is displayed as floating bars with the max/min values and mean (thicker band). Biological replicates are: PBS + Vehicle, n = 4; PBS + VHHmASC, n = 3; mBSA + Vehicle, n = 6; mBSA + VHHmASC, n = 6; mBSA + IL‐1RA, n = 5.
-
DFlow cytometric assessment of infiltrating total leukocytes (CD45+), granulocytes (CD45+ Ly6G+ Ly6C−), and inflammatory monocytes (CD45+ Ly6G− Ly6C+) recovered in the synoival fluid of the knee joints of mice treated as in (A). Data is displayed as floating bars with the max/min values and mean (thicker band). Biological replicates are: PBS + Vehicle, n = 4; PBS + VHHmASC, n = 3; mBSA + Vehicle, n = 6; mBSA + VHHmASC, n = 6; mBSA + IL‐1RA, n = 5.
-
EELISA of IL‐1β, TNFα and IL‐6 in tissue homogenates of knee joints of mice treated as in (A). Data is displayed as floating bars with the max/min values and mean (thicker band). Biological replicates are: PBS + Vehicle, n = 4; PBS + VHHmASC, n = 3; mBSA + Vehicle, n = 6; mBSA + VHHmASC, n = 6; mBSA + IL‐1RA, n = 5.
Data information: ns P > 0.05; *P < 0.05; **P < 0.01; ***P < 0.001; ****P < 0.0001, One‐way ANOVA, multiple comparison (Tukey test). Data with non‐normal distribution were tested with Krustal–Wallis test and multiple comparison using Dunn’s test. Outliers were determined by the ROUT method and are represented with Δ.