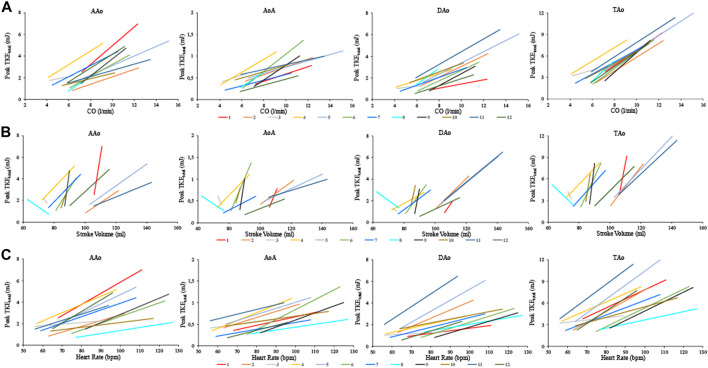
FIGURE 5.
The relation between Peak TKEtotal and CO (A), left ventricular stroke volume (B), and heart rate (C) for each of the 12 healthy subjects in the four aortic regions at rest and with dobutamine infusion. CO, cardiac output; AAo, ascending aorta; AoA, arcus aorta; DAo, descending aorta; TAo, thoracic aorta.

