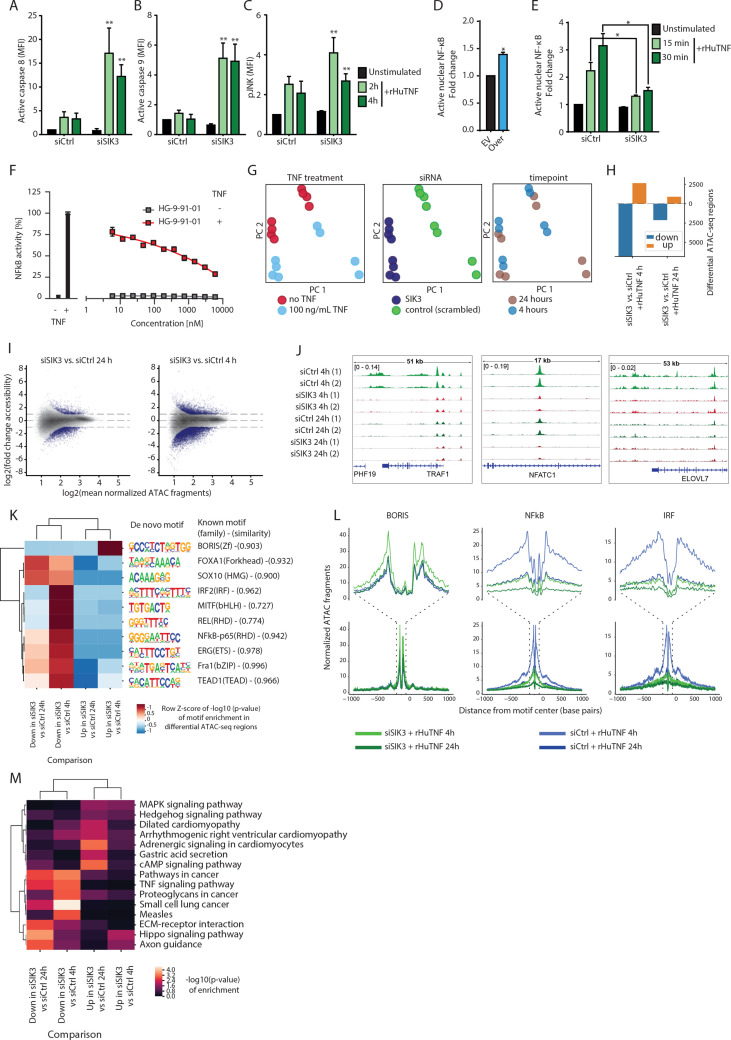
Figure 4.
SIK3 prevents TNF-induced apoptosis via NF-κB activation. (A–C) siRNA-transfected PANC-1-luc cells were treated with 100 ng/mL of rHuTNF. At the indicated time points, tumor cells were harvested and total protein fraction was isolated. Luminex assay was performed for active caspase 8 (A), active caspase 9 (B), and pJNK (C). Graphs show MFI of analyte-specific beads after normalization to Glyceraldehyde-3-phosphate dehydrogenase (GAPDH). (D) PANC-1 cells were transiently transfected either with SIK3 overexpressing vector (Over) or with control vector (EV) for 48 hours. Afterwards, ELISA was performed for detection of nuclear p65 subunit of NF-κB. (E) PANC-1 cells were transfected with indicated siRNAs for 72 hours and treated with 100 ng/mL rHuTNF or culture medium for the indicated time points. p65 NF-κB ELISA was conducted as in (D). (F) Effect of pharmacological SIK3 inhibition on NF-κB activity. PANC-1 cells expressed luciferase under the control of an NF-κB promoter. Reporter PANC-1 were treated with different concentrations of HG-9-91-01 before the addition of 10 ng/mL rHuTNF for 8 hours. Cells were lysed and luciferase activity was measured. Data are shown as percent of NF-κB activity normalized to PANC-1 cells treated with 10 ng/mL rHuTNF without inhibitor. (G) Principal component analysis based on all identified chromatin accessible sites over all samples comprising siRNA transfected PANC-1-luc cells that were either untreated or treated with 100 ng/mL of rHuTNF for 4 hour or 24 hours. (H) Numbers of significant differentially accessible regions between comparison of SIK3 knockout and WT PANC-1 cells treated with rHuTNF for 4 or 24 hours (Benjamini-Hochberg corrected padj <0.05, log2 fold change >1, normalized mean accessibility ≥10). (I) M (log ratio) and A (average) (MA)-plot showing the log2 fold change and mean accessibility in the comparisons from (H). Significant differentially accessible regions are colored in dark violet. (J) Representative IGV genome browser snapshots of the TRAF1 locus for SIK3 knockdown and WT PANC-1 cells treated with rHuTNF for 4 or 24 hours. (K) Motif analysis of individual comparisons from (H). color code of heatmap indicates significance (z-score of log10 p value) of de novo identified transcription factor motifs in differential peaks from the respective pairwise comparisons. (L) ATAC-seq signal at motif-centered peaks containing the de novo discovered motifs of BORIS, NF-κB, and IRF from (K). X-axis shows distance from motif center in bp, y-axis number of normalized reads. (M) Kyoto Encyclopedia of Genes and Genomes (KEGG) pathway enrichment of genes in the vicinity of differential accessible chromatin regions from comparisons in (H). (A–C, E) Cumulative data of three independent experiments. (D, F) Representative data of at least two independent experiments. Columns show mean±SEM. P values were calculated using two-tailed Student t-test. *P<0.05, **P<0.01. ATAC-seq, assay for transposable-accessible chromatin with sequencing; bp, base pair; EV, empty vector; IRF, interferon regulatory factor; MFI, median fluorescent intensity; NF-κB, nuclear factor kappa B; pJNK, c-Jun N-terminal protein kinase; rHuTNF, recombinant tumor necrosis factor; SIK3, salt-inducible kinase 3; TNF, tumor necrosis factor; WT, wild type.

