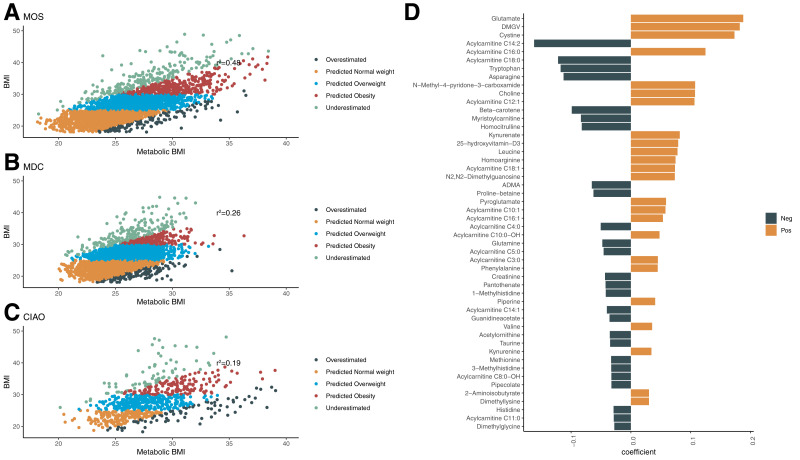
Figure 1.
Metabolite prediction of BMI. Correlation between ridge regression–based prediction of BMI (mBMI) and BMI in MOS (n = 3,263) (A), MDC (n = 3,579) (B) and CIAO (n = 821) (C). The outlier groups were defined as having an mBMI >5 kg/m2 higher than BMI (OE) or an mBMI <5 kg/m2 lower than BMI (UE). The remaining participants were categorized according to their BMI as NW (<25 kg/m2), OW (25–30 kg/m2), and OB (>30 kg/m2). The coefficients of the top 30 metabolites in the ridge regression model are shown (D). Neg, negative; Pos, positive.

