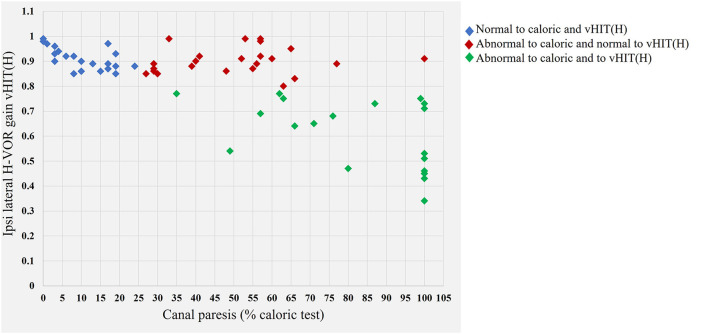
Figure 3.
Graph illustrating the relationship between the horizontal vestibulo-ocular gain in the vHIT test and canal paresis in the caloric test. Blue diamonds indicate the normal values for the caloric test and vHIT (H). Red diamonds indicate values for patients with a normal vHIT result but abnormal caloric test results (canal paresis >25%). A dissociation is observed between the findings for the two different tests of horizontal nerve function [normal vHIT (H)—abnormal canal paresis]. Green diamonds, abnormal results in both the caloric test and vHIT (H).

