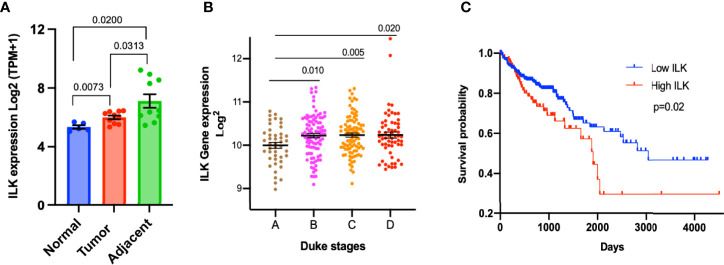
Figure 2.
Upregulation of ILK expression in CRC tumors and its correlation with prognosis. (A) The ILK expression levels (Log2(TPM+1)) were examined in a dataset (GSE95132) includes 10 CRC patients (10 CRC tumor tissues (Tumor) and their 10 adjacent non-tumor tissues (Adjacent)) and 5 non-cancer individuals (5 normal colonic crypts (Normal)). The dataset GSE95132 was downloaded from GEO database. (B) ILK expression and its relationship with the Duke’s stages of CRC compared by using the GENT2 database. The stages pf CRC (n = 290) are stage A (n = 44); stage B (n = 94); stage C (n = 91); and stage D (n = 61). The figure was reproduced from the Gene Expression database of Normal and Tumor tissue (GENT2) at http://gent2.appex.kr/gent2/. (C) Kaplan–Meier curve of overall survival rate between COAD patients showing high and low ILK mRNA expression in the TCGA database through the human protein atlas. The patients were divided into low and high ILK mRNA expression groups, below and above the best cut-off (4.57 FPKM) respectively. Low ILK expression patients (n = 335) and high ILK expression patients (n = 103). The figure was reproduced from the human protein atlas at https://www.proteinatlas.org/ENSG00000166333-ILK/pathology/colorectal+cancer/COAD. Error bars are represented as mean ± SEM. P-value was analyzed with an unpaired t-test. Significant P-value is <0.05. The significant P-value is <0.05.

