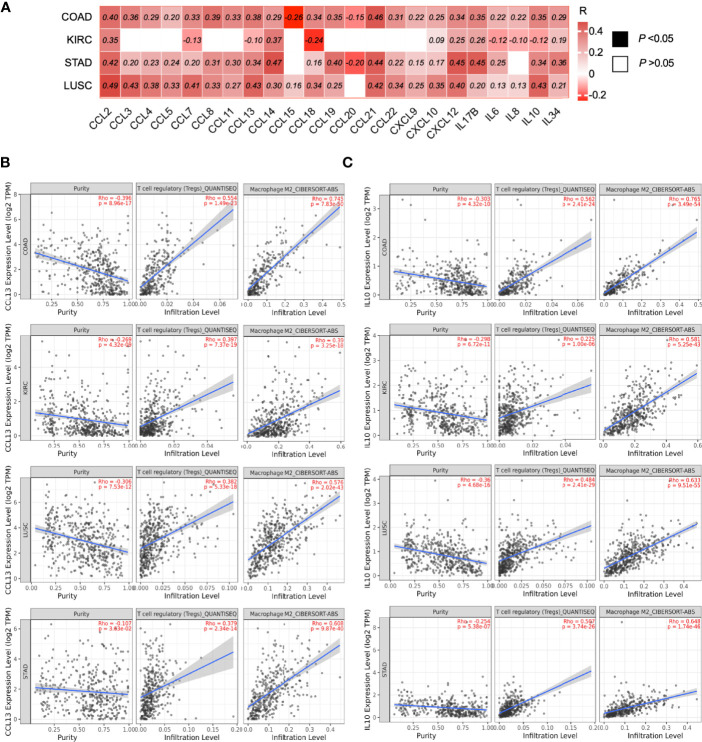
Figure 7.
ILK expression is correlated with the expression of chemokines and cytokines implicated in immunosuppressive cell infiltration. (A) Heat map of different chemokine and cytokine gene expression and their correlations with ILK in COAD, KIRC, STAD and LUSC were examined via TIMER. The values in the heat map are for the spearman’s correlation Rho, R. The scale on the right of the heat map is for R values. All colored squares are statistically significant whereas white squares are not statistically significant. The R values above 0.08 are statistically significant. (B) CCL13 correlation with tumor purity, Treg and M2 infiltration. (C) IL10 correlation with tumor purity, Treg and M2 infiltration. Significant P-value is <0.05.

