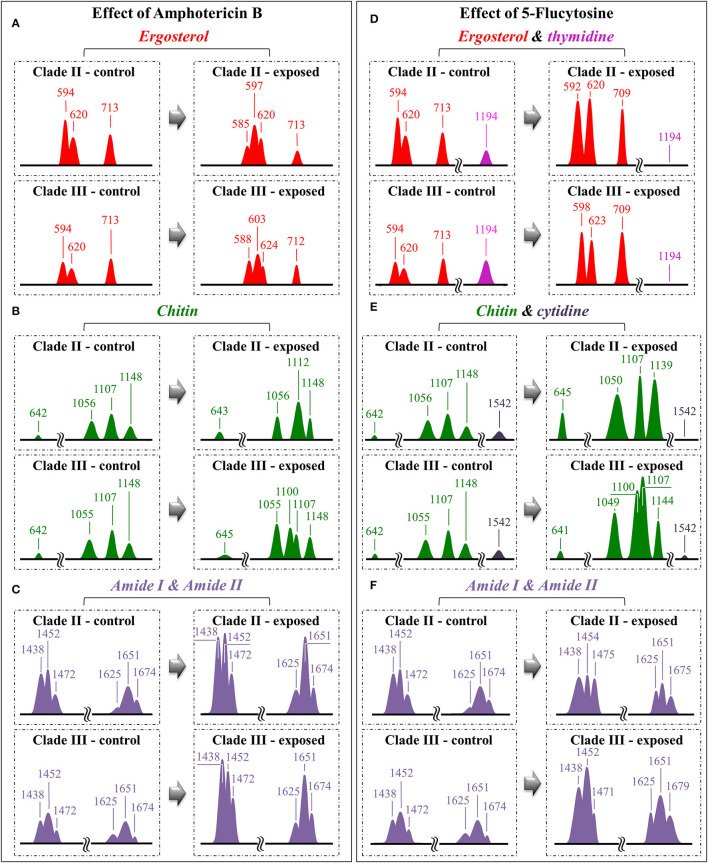
Figure 8.
Diagrams drawn to summarize the spectroscopic differences recorded between contro and drug-treated C. auris (cf. labels); the sub-band components discussed in the text as markers of specific molecules are redrawn and compared with respect to their normalized intensities and wavenumber positions: for the effects of Amphotericin B, Ergosterol (A), Chitin (B) and Amide I & II (C); for the effect of 5-Flucytosine, Ergosterol & thymidine (D), Chitin & cytidine (E) and Amide I & II (F).

