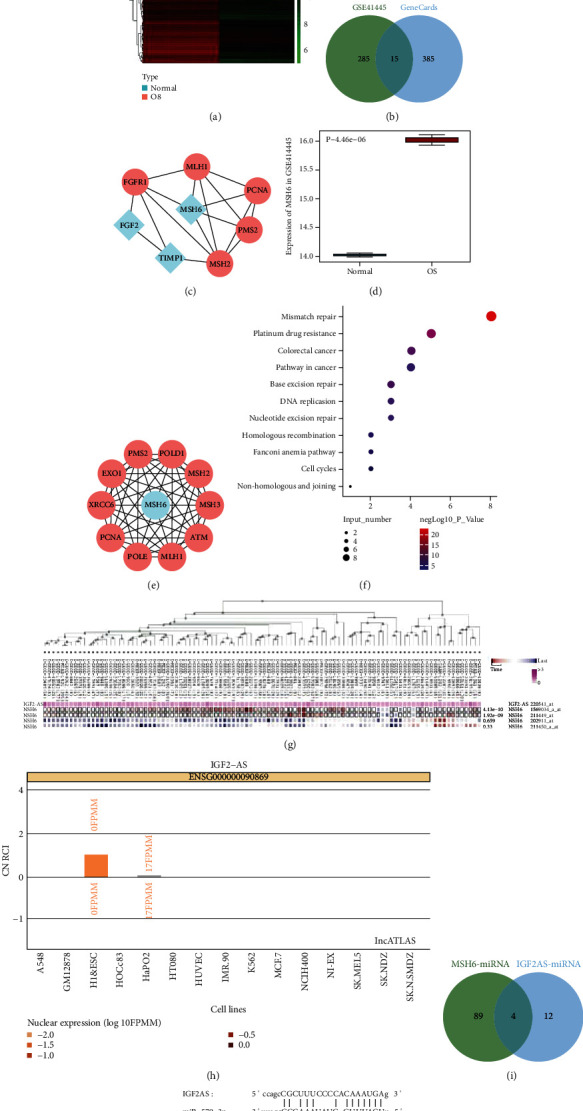
Figure 3.

IGF2-AS may competitively bind to miR-579-3p to elevate MSH6 expression in OS. (a) Heat map of top 300 significantly upregulated gene expressions on microarray GSE41445 (normal: n = 3; OS: n = 3). (b) Venn diagram of the intersection of the top 300 upregulated genes of the microarray GSE41445 and the top 400 OS-associated genes predicted by the GeneCards database. There were 15 genes in the intersection. (c) Interaction network diagram of TIMP1, MSH6, FGF2, and their interaction genes; blue indicated input genes, and red indicated predicted genes. (d) The expression box plot of MSH6 in the microarray GSE41445; the blue box on the left represented the expression of normal samples (n = 3), and the red box on the right represented the expression of OS samples (n = 3). (e) Interaction network diagram of MSH6 and its interaction genes; blue referred to the input genes, and red referred to the predicted genes. (f) Bubble chart of KEGG enrichment of MSH6 and its interaction genes. The vertical axis represented the enriched item, the horizontal axis and bubble size represented the number of genes enriched in the item, and the color of the bubble indicated significance as shown in the color scale on the right (-logP value). (g) Coexpression of IGF2-AS and MSH6 assessed by MEM database analysis. (h) The lncATLAS database analysis to predict the subcellular localization of IGF2-AS. (i) The StarBase database analysis to predict the targeted binding miRNAs of IGF2-AS and MSH6. There were 4 intersecting miRNAs. (j) StarBase database analysis to predict the binding sites between IGF2-AS and miR-579-3p and between miR-579-3p and MSH6. ∗p < 0.05.
