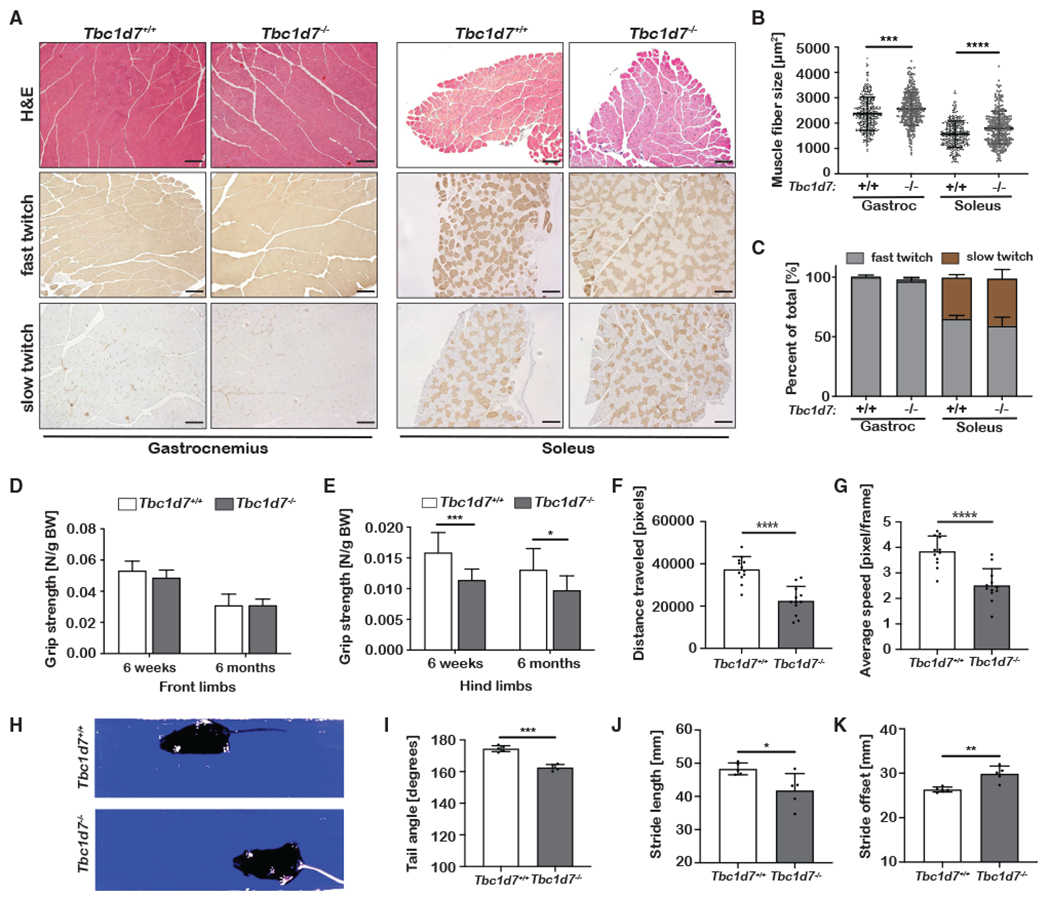
Figure 2. Muscle and gait analysis of Tbc1d7 knockout mice.

(A–C) Histological cross-sections of muscle from 6-week-old mice stained as indicated. Scale bars, 100 μm. (B) Cross-sectional muscle-fiber area graphed as mean ± SD.
(C) Quantification of muscle-fiber types graphed as mean percentage of total ± SD. n = 4.
(D and E) Front-limb (D) and hind-limb (E) grip strength measured at 6 weeks and 6 months of age graphed as mean ± SD. 6 week: n = 9 Tbc1d7+/+ and 13 Tbc1d7−/− 6 month: n = 13 Tbc1d7+/+ and 12 Tbc1d7−/−.
(F and G) Open-field test of 6-month-old mice, with (F) distance traveled and (G) speed graphed as mean ± SD. n = 12.
(H–K) Video-recorded gait analysis of 6-month-old mice with (I) tail angle, (J) stride length, and (K) stride offset graphed as mean ± SD. n = 5.
Statistical analysis (B, E–G, and I–K) by Student’s t test, *p < 0.05, **p < 0.01, ***p < 0.001, ****p < 0.0001.
