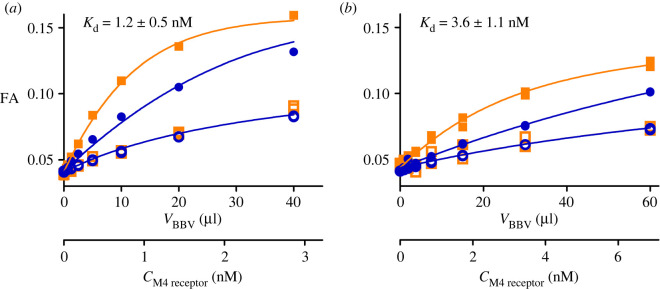
Figure 2.
Binding curves of fluorescent ligand binding to M4 receptor. 1 nM (squares) or 6 nM (circles) UR-MK342 (a) or 2 nM (squares) or 20 nM (circles) UR-CG072 (b) incubated with different concentrations M4 receptor. Total binding (filled symbols) was determined in the absence and non-specific binding (open symbols) in the presence of 1000-fold excess of UNSW-MK259 in the case of UR-CG072 or scopolamine in the case of UR-MK342. The 1 h measurement point for UR-CG072 and 5 h measurement point for UR-MK342 are shown and was used for calculations. The concentration of M4 receptor binding sites (CM4 receptor) was calculated post hoc from the results of these experiments using the model described in [27]. A representative experiment of at least three independent experiments is shown. Experiments were performed in duplicates with all measurement data points shown.

