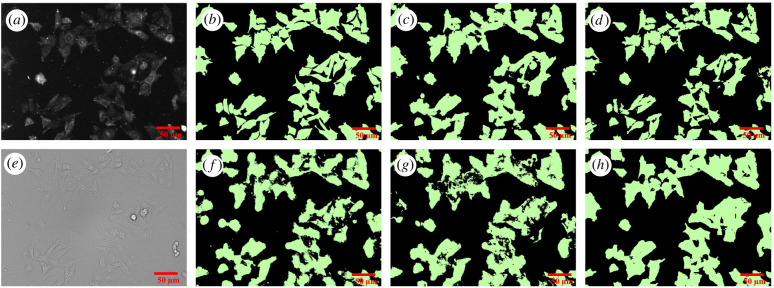
Figure 7.
Microscopy images and corresponding binary masks of CHO-K1-hM4R cells stained with DiI. The top row shows cell detection from the fluorescence image (a) by manual segmentation (b), RF-FL-1 model (c) and U-Net3-FL-1 (d). The bottom row shows cell detection from the bright-field image (e) by RF-BF-1 model (f), RF-BF-2 model (g) and U-Net3-BF-1 (h). The scale bar corresponds to 50 µm.

