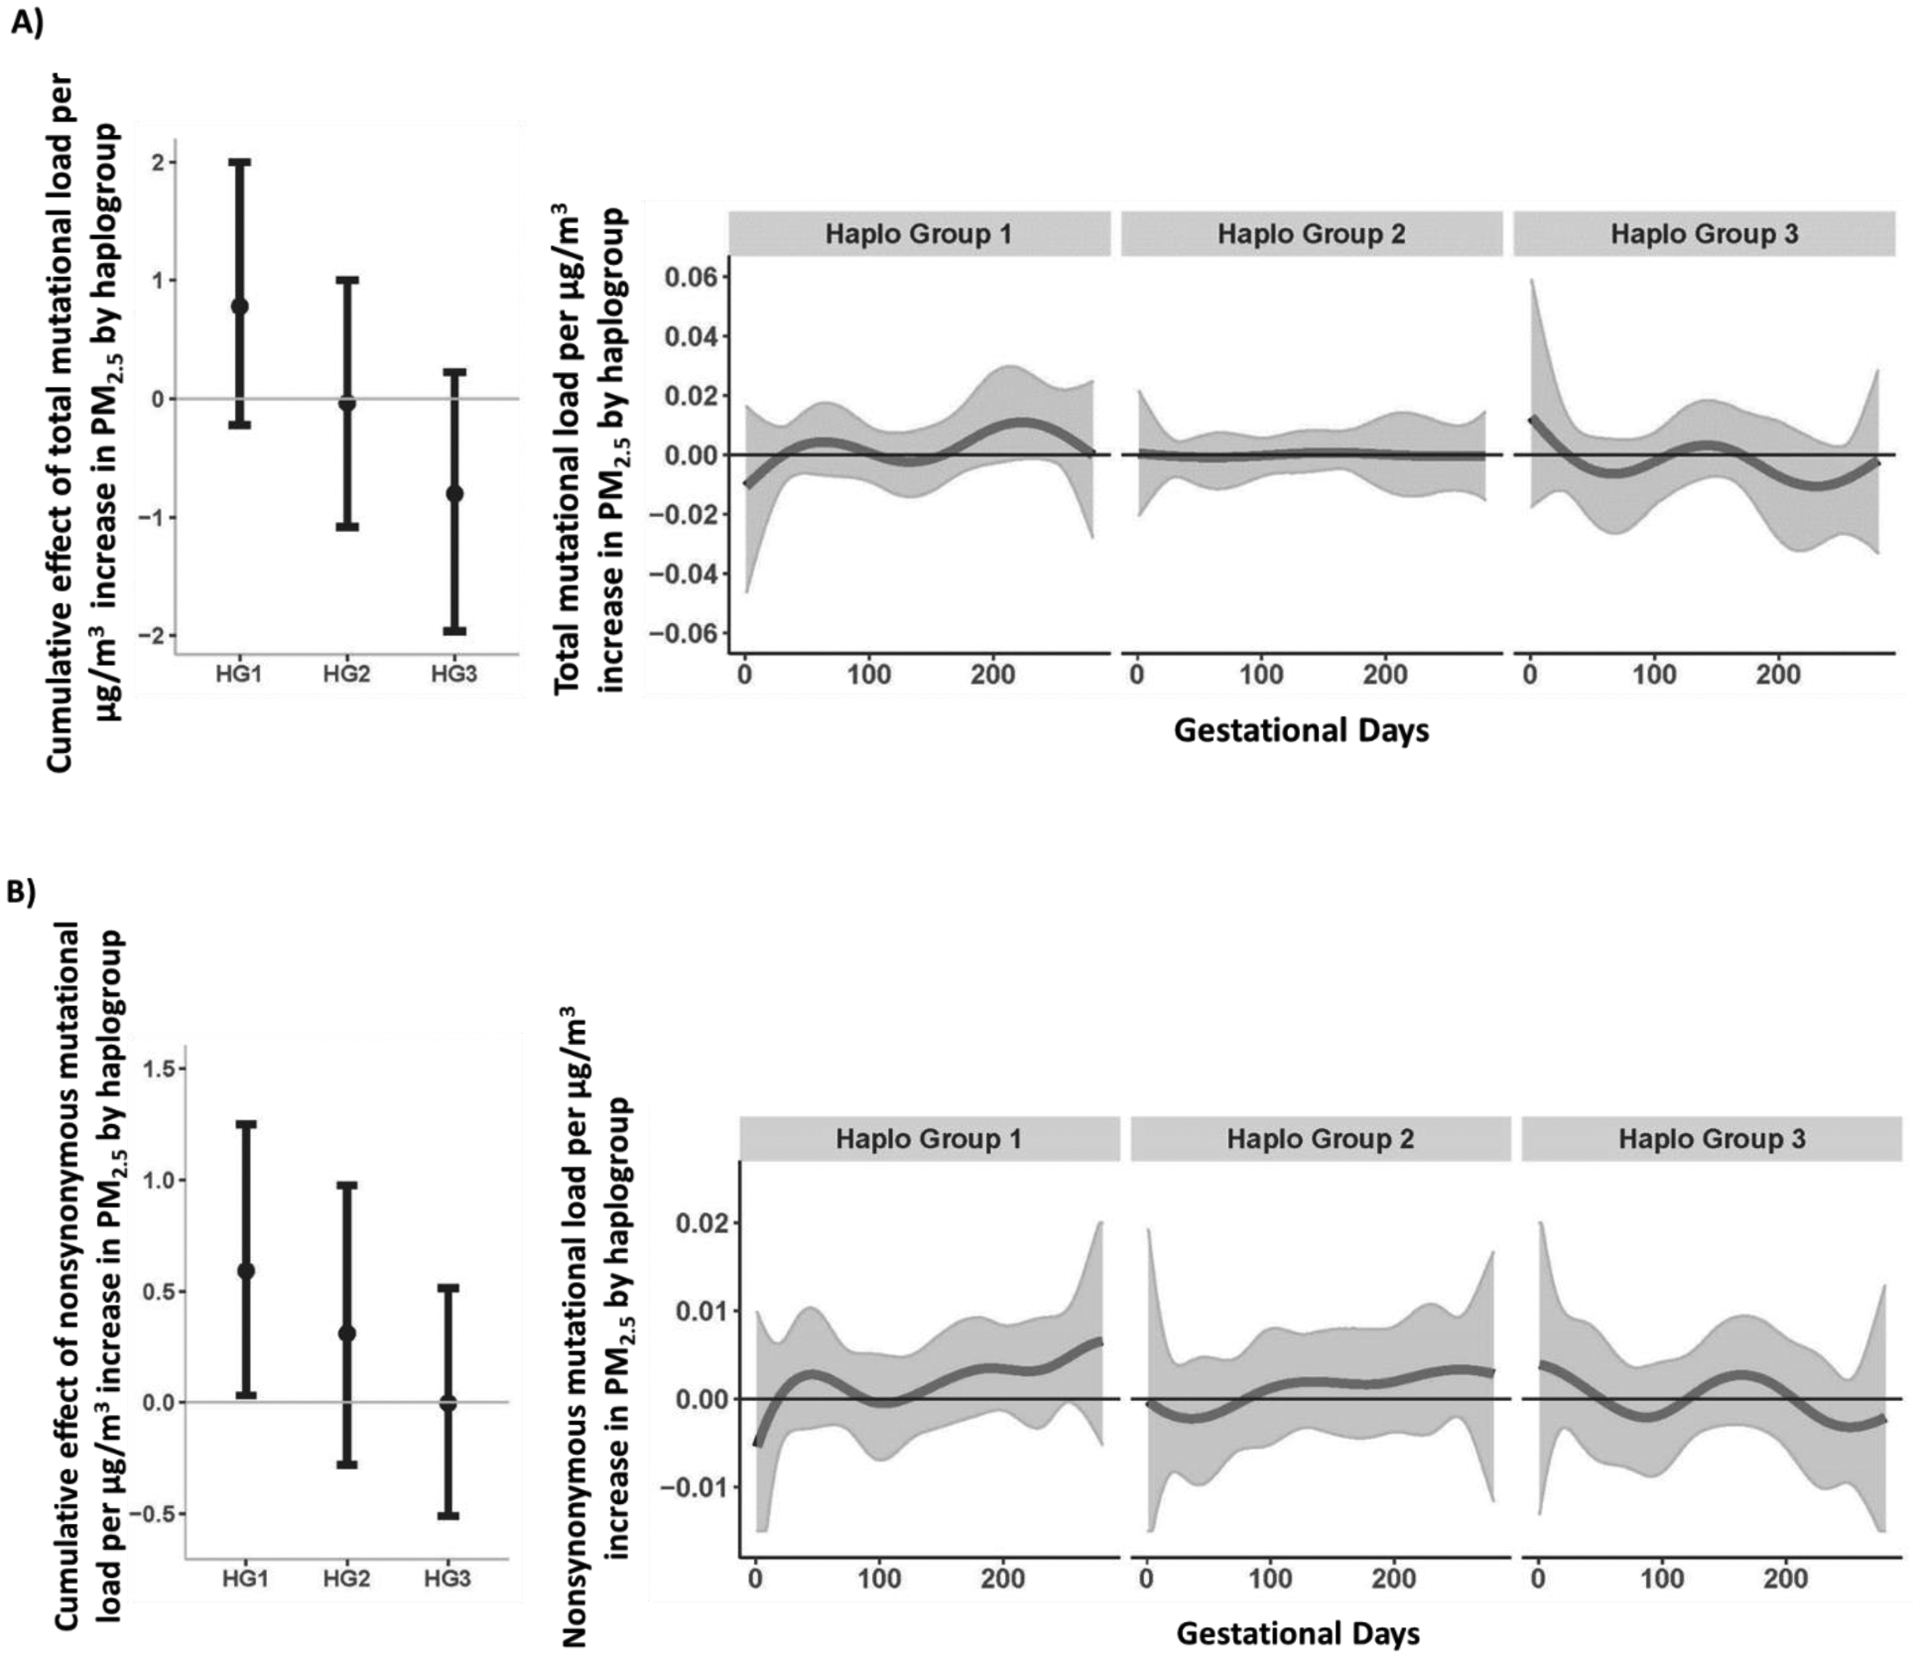
Figure 2. Cumulative and time-varying associations between daily PM2.5 levels over gestation and placental mtDNA total (A) and nonsynonymous (B) mutational loads by haplogroup.

This figure demonstrates the effect modification by haplogroup on the association between PM2.5 exposure over pregnancy and mtDNA mutational load in placenta, using BDLIM assuming daily-specific effects. The models were adjusted for maternal age, education, race/ethnicity, child sex, and ambient temperature. The y-axis represents the combined cumulative effect of time-varying prenatal PM2.5 exposure on increased mtDNA mutational loads for each haplogroup for which the BDLIM detected an interaction. Solid lines for time-varying associations show the predicted change in mtDNA mutational load. Gray areas indicate 95% confidence intervals (CIs). A sensitive window is identified for the days where the estimated pointwise 95% CI (shaded area) does not include zero. We did not observe any sensitive windows by haplogroup. Abbreviations [Haplogroup1 (African); Haplogroup 2 (Native American/Asian); Haplogroup 3 (European)].
